Stats, analysis, commentary.
The short-handed Washington Wizards gave their best post-All-Star break effort in last night’s 114-105 loss to the Cleveland Cavaliers.
The Wizards kept things interesting throughout. Kyle Kuzma hit his first five shots and led the offense in the early going, and Washington led at the end of the first quarter. Cleveland outplayed them the rest of the way and threatened at a couple points to break the game open. Each time, the Wizards battled back to make it a competitive contest.
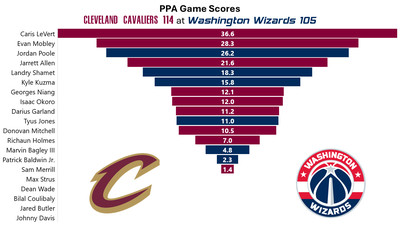
The story of the night was Jordan Poole having a good game — his best by my reckoning in more than six weeks. He finished with an efficient 31 points, 5 rebound, and 5 assists and had a role in corralling Donovan Mitchell and Darius Garland into subpar games.
This was the kind of production the Wizards envisioned when they acquired Poole in the Bradley Beal trade.
Now, I must confess that I remain a skeptic when it comes to Poole. He hit 6-13 from deep, and his offensive rating (points produced per possession x 100) was 137 on 25.6% usage, but I don’t think he played different than he has all season. His shot selection was still pretty bad, he still committed nonsensical fouls, got out of position on defense, gave up middle defending drives, and was ineffective in pick-and-roll defense against Max Strus.
Good results, for sure. The process and decision-making? I wasn’t a fan.
Hopefully this is the start of Poole’s performance turning a corner — the Wizards need him playing much better than he has this season. But maybe take it slow. He’s done this kind of thing before.
According to my handy performance tracker and ekg, he’s had five games this season. Here’s a look at where his performance has been this season (according to my PPA metric — in PPA, 100 is average, higher is better, 200+ is All-NBA and/or MVP level, 175+ is All-NBA level, 150+ is typically the minimum score for an All-Star):
- 200+ — 5 — 9%
- 150+ — 11 — 20%
- 100+ — 17 — 31%
- 100> — 38 — 69%
- 45> — 30 — 55%
- 0> — 21 — 38%
If you’re looking at the table above and thinking, “Poole’s had four times as many games that scored a negative as he’s had above 200,” give yourself a cookie. I mean, give yourself a cookie anyway, you deserve it.
He’s had consecutive average or better games four times this season. Back in January, he had three consecutive (and four out of five) above average games. His performance cratered after each.
By the way, I think the idea that he’s somehow been misused by the Wizards or played out of position is utter nonsense. He was “off ball” in the sense that Tyus Jones brought the ball up the court. Once there, Poole was a team leader in touches, usage, isolations, and pick-and-roll sets. They ran him off screens. They used him as a spot up shooter. His play was abysmal.
Recognizing how badly he was struggling, they shuffled the rotation so he could be the primary ball handler with the bench unit — meaning with Jones and Kuzma off the floor. He continued to be among the team leaders in touches, usage, isolations, and pick-and-roll. His play remained abysmal. They stuck with that rotation for weeks, even as Poole continued to play poorly.
Finally, they came back from the All-Star break and dropped him from the starting lineup. Since then, he played two terrible games and one good one. We’ll see.
The point here is simply this: tap the brakes on thinking he’s figured things out. This was his 55th game of the season, and more than half have rated at or below replacement level. He needs to prove he’s figured things out with a sustained stretch of good play. Not necessarily being good every game, but being a positive contributor more often than not. That’s a bar he hasn’t cleared this season.
Little of the forgoing has much to do with his game last night, which was good because he made shots. While I thought his shot selection was bad, I’m also pragmatic enough to know that a player who consistently makes shots is valuable — even if the shots look difficult or ill-advised.
Four Factors
Below are the four factors that decide wins and losses in basketball — shooting (efg), rebounding (offensive rebounds), ball handling (turnovers), fouling (free throws made).
Stats & Metrics
Below are a few performance metrics, including the Player Production Average (PPA) Game Score. PPA is my overall production metric, which credits players for things they do that help a team win (scoring, rebounding, playmaking, defending) and dings them for things that hurt (missed shots, turnovers, bad defense, fouls).
Game Score (GmSC) converts individual production into points on the scoreboard. The scale is the same as points and reflects each player’s total contributions for the game. The lowest possible GmSC is zero.
PPA is a per possession metric designed for larger data sets. In small sample sizes, the numbers can get weird. In PPA, 100 is average, higher is better and replacement level is 45. For a single game, replacement level isn’t much use, and I reiterate the caution about small samples sometimes producing weird results.
POSS is the number of possessions each player was on the floor in this game.
ORTG = offensive rating, which is points produced per individual possessions x 100. League average last season was 114.8. Points produced is not the same as points scored. It includes the value of assists and offensive rebounds, as well as sharing credit when receiving an assist.
USG = offensive usage rate. Average is 20%.
ORTG and USG are versions of stats created by former Wizards assistant coach Dean Oliver and modified by me. ORTG is an efficiency measure that accounts for the value of shooting, offensive rebounds, assists and turnovers. USG includes shooting from the floor and free throw line, offensive rebounds, assists and turnovers.
+PTS = “Plus Points” is a measure of the points gained or lost by each player based on their efficiency in this game compared to league average efficiency on the same number of possessions. A player with an offensive rating (points produced per possession x 100) of 100 who uses 20 possessions would produce 20 points. If the league average efficiency is 114, the league — on average — would produced 22.8 points in the same 20 possessions. So, the player in this hypothetical would have a +PTS score of -2.8.

