Stats, analysis, commentary.
I’m old enough to remember when the Wizards had a stretch of games where they were playing better. Their record during the span was 4-7, and I wrote about their improved defense. At the time, I wondered if that defensive improvement was just a lucky downturn in opponent three-point shooting. In the five games since? Opponent three-point shooting has rocketed to 40.3%. Call it an unlucky upturn in opponent three-point shooting.
Last night, the Chicago Bulls bombed away, hitting 23-49 (46.9%). This is the Bulls game — they take the second most threes (behind the Boston Celtics) and they entered the game ninth in three-point percentage. They’ll probably move up a slot or two on their three-point binge against the Wizards. The 23 made threes ties for the second most made in a game by the Bulls this season.
Signals that this would be a blowout started early when the Wizards repeatedly failed to execute basics like running back on defense. Instead, they gave Zach LaVine and the Bulls repeated free runs at the basket for an array of dunks and layups. While the Bulls outshot Washington 23-18 from three-point range, they also outscored the Wizards 52-42 in the paint, 17-8 on second chance points (despite the Wizards grabbing two more offensive rebounds), and 24-11 in fastbreak points.
Chicago had an effective field goal percentage of 67.9% — their second best mark of the season. It’s the best shooting night of the season by a Wizards opponent. The previous high was a 67.0% eFG% on Nov. 18 by the New York Knicks.
It was a thorough drubbing.
Bright spots?
- Jordan Poole returned from a few games out with a hip injury to score 23 points on 13 shots in just 24 minutes. He shot 6-9 from three and generally looked healthy and ready to play. I didn’t love the three turnovers, but he posted a 131 offensive rating on 27.2% usage, which is excellent.
- Jared Butler played another excellent game off the bench — 18 points on 8-12 shooting, 6 rebounds, 4 assists, and a block…in 21 minutes. He was aggressive, confident, and looks like he belongs on an NBA court.
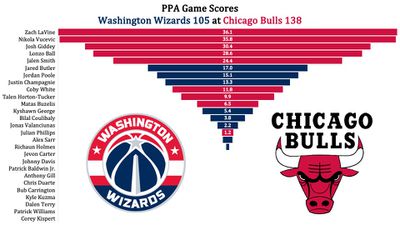
- Justin Champagnie made the most of the 11 minutes he got — 11 points on 6 shots, 2 rebounds, an assist and a steal. Champagnie continues to hold the team lead in PPA, my overall production metric. In PPA, average is 100 and higher is better. Entering the game, Champagnie’s PPA was 121 — one point ahead of Poole.
- Kyshawn George hit 4-8 from three-point range. The good shooting boosted his three-point percentage for the year to 25.3%. I know this might sound like snark, but I don’t mean it that way. Just as I was when fellow rookie Alex Sarr kept shooting earlier in the season despite the poor three-point percentage, I’m glad George has kept hoisting the shots. If he’s going to be a long-term contributor, he needs to be able to hit threes at a good rate. Last night was a step in the right direction.
Four Factors
Below are the four factors that decide wins and losses in basketball — shooting (efg), rebounding (offensive rebounds), ball handling (turnovers), fouling (free throws made).
Stats & Metrics
Below are a few performance metrics, including the Player Production Average (PPA) Game Score. PPA is my overall production metric, which credits players for things they do that help a team win (scoring, rebounding, playmaking, defending) and dings them for things that hurt (missed shots, turnovers, bad defense, fouls).
Game Score (GmSC) converts individual production into points on the scoreboard. The scale is the same as points and reflects each player’s total contributions for the game. The lowest possible GmSC is zero.
PPA is a per possession metric designed for larger data sets. In small sample sizes, the numbers can get weird. In PPA, 100 is average, higher is better and replacement level is 45. For a single game, replacement level isn’t much use, and I reiterate the caution about small samples sometimes producing weird results.
POSS is the number of possessions each player was on the floor in this game.
ORTG = offensive rating, which is points produced per individual possessions x 100. League average last season was 114.8. Points produced is not the same as points scored. It includes the value of assists and offensive rebounds, as well as sharing credit when receiving an assist.
USG = offensive usage rate. Average is 20%.
ORTG and USG are versions of stats created by former Wizards assistant coach Dean Oliver and modified by me. ORTG is an efficiency measure that accounts for the value of shooting, offensive rebounds, assists and turnovers. USG includes shooting from the floor and free throw line, offensive rebounds, assists and turnovers.
+PTS = “Plus Points” is a measure of the points gained or lost by each player based on their efficiency in this game compared to league average efficiency on the same number of possessions. A player with an offensive rating (points produced per possession x 100) of 100 who uses 20 possessions would produce 20 points. If the league average efficiency is 114, the league — on average — would produced 22.8 points in the same 20 possessions. So, the player in this hypothetical would have a +PTS score of -2.8.

by Kevin Broom
