Stats, analysis, commentary. Halftime shows?
The best part of the Wizards trip to face the Oklahoma City Thunder was Viola Brand’s halftime performance. Brand is a German artistic cyclist who’s won national and European championships twice, and took silver three times in the World Championships. She impressed with a Supergirl stunt where she did a horizontal handstand on a moving bicycle.
She did a bunch of other impressive tricks, which are difficult to describe, in part because I know nothing her sport except that it was a helluva good halftime show. The favorite at my house was when she stood on the handlebars and drove strong into the paint for a layup. Unlike Wizards players, she converted at-rim and didn’t fall down for no apparent reason.
I’d have to do some video review to refresh my memory, but I’m comfortable slotting Brand into the top five of my all-time halftime show rankings.
Number one is surely Red Panda. The ability to flip bowls using one foot while balancing on a unicycle is next level artistry. Two acts are pretty close: Quick Change (unfortunately no longer changing), and Rubber Man — a contortionist who’d pass himself through smaller and smaller objects, including a tennis racket (without the strings) and a toilet seat. I’m not sure if he’s still performing.
That top three is in ink. Brand goes into a three-way mix for two spots in the top five with the guy who balances ladders on his chin, and Christian & Scooby, an adorable Chihuahua and his human who do amazing feats of acrobatics and strength.
So to round out my top five, I’m putting Brand at four, the chin balancer guy at five, and Christian & Scooby fall to sixth.
The Wizards and Thunder also had a game. To sum up: the Wizards played their usual brand of defense except their opponent hit half their threes, and the Wizards laid more bricks than usual, so they lost by 41 instead of 18.
Bright spots? Hmm…Marvin Bagley III grabbed 10 offensive rebounds, helped along by his teammates missing 60+% of their shots. Corey Kispert hit some threes and had a couple steals. Bilal Coulibaly made a few offensive plays during garbage time. That’s about it.
Everyone else was some flavor of terrible. Except Justin Champagnie — he scored twice in garbage time.
Jordan Poole seemed very nearly competent for a few minutes before reverting back to his usual assortment of embarrassing blunders, arguing with refs when the refs clearly had the call correct, and bizarre heat checks when there’s no indication he’s hot. He finished the game 7-19 from the floor with three turnovers — an offensive rating (points produced per possession x 100) of 96 on a usage rate of 39.1%.
In 23 minutes of action, Poole had more field goal attempts than MVP contender Shai Gilgeous-Alexander did in 30.
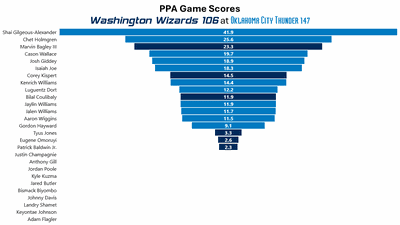
Kyle Kuzma, Johnny Davis, and Landry Shamet saved Poole from the ignominy of finishing last on the team’s production stats (see below).
The Thunder had an effective field goal percentage of 70.7%, which marks the second time this season the Wizards have allowed an opponent to shoot better than 70%. OKC’s mark was actually the second best shooting night against Washington — the top spot goes to the Orlando Magic, which shot 70.8% on November 29.
The Wizards shot 43.8% (efg), their second worst shooting night of the season. The worst was 43.2% on November 8 at the Brooklyn Nets.
In a night filled with defensive blunders and blown assignments, Kuzma had maybe the most egregious — closing out on Josh Giddey (a poor three-point shooter) and then sticking close to him when Giddey passed instead of making the effort to contest the corner three from a better shooter who was all of MAYBE 10 feet away. So much for the veteran knowing the opponent’s personnel, executing the game plan, or even making the “extra” effort to help establish a hard working team culture.
Hey, bright side again: the Wizards did manage to keep Oklahoma City under 150…by giving wide-open threes to Adam Flagler in the closing minutes, who kept missing.
Blech.
At least the Thunder had that halftime show.
Four Factors
Below are the four factors that decide wins and losses in basketball — shooting (efg), rebounding (offensive rebounds), ball handling (turnovers), fouling (free throws made).
Stats & Metrics
Below are a few performance metrics, including the Player Production Average (PPA) Game Score. PPA is my overall production metric, which credits players for things they do that help a team win (scoring, rebounding, playmaking, defending) and dings them for things that hurt (missed shots, turnovers, bad defense, fouls).
Game Score (GmSC) converts individual production into points on the scoreboard. The scale is the same as points and reflects each player’s total contributions for the game. The lowest possible GmSC is zero.
PPA is a per possession metric designed for larger data sets. In small sample sizes, the numbers can get weird. In PPA, 100 is average, higher is better and replacement level is 45. For a single game, replacement level isn’t much use, and I reiterate the caution about small samples sometimes producing weird results.
POSS is the number of possessions each player was on the floor in this game.
ORTG = offensive rating, which is points produced per individual possessions x 100. League average last season was 114.8. Points produced is not the same as points scored. It includes the value of assists and offensive rebounds, as well as sharing credit when receiving an assist.
USG = offensive usage rate. Average is 20%.
ORTG and USG are versions of stats created by former Wizards assistant coach Dean Oliver and modified by me. ORTG is an efficiency measure that accounts for the value of shooting, offensive rebounds, assists and turnovers. USG includes shooting from the floor and free throw line, offensive rebounds, assists and turnovers.
+PTS = “Plus Points” is a measure of the points gained or lost by each player based on their efficiency in this game compared to league average efficiency on the same number of possessions. A player with an offensive rating (points produced per possession x 100) of 100 who uses 20 possessions would produce 20 points. If the league average efficiency is 114, the league — on average — would produced 22.8 points in the same 20 possessions. So, the player in this hypothetical would have a +PTS score of -2.8.

