Stats, commentary, analysis.
With four players age 20 or younger playing more than half the team’s minutes, Washington fought hard before falling to the New York Knicks in overtime, 136-132.
The story of the game was the offensive onslaught of Jalen Brunson, who scored 55 points on 31 shots and dished for 9 assists. Brunson put on a display of craft and skill that Wizards fans should hope the team’s youngsters internalize.
Washington built a lead and kept the final margin close with superb three-point shooting. They hit 17-38 — a lofty 44.7%. The Knicks were 10-40 (25.0%), giving the Wizards a 21-point advantage from long range. New York pummeled Washington inside (78-60 points in the paint) and from the free throw line (24 made free throws to Washington’s 13).
Bright spots?
- Justin Champagnie played possibly the best game of his career — 31 points on 13-15 shooting (including 5-6 from three), 10 rebounds (4 on the offensive glass), and 2 steals. He was hot enough that on Playback before the final possession of regulation, I suggested the Wizards run a play to let him take the final shot. Not only did head coach Brian Keefe not take my advice, he took Champagnie out of the game for that possession.
- Bub Carrington avoided the fouling and turnovers that have plagued his game and turned in a solid 17 points, 5 rebounds, 5 assists. He stayed on the court for 43 minutes of this one.
- Bilal Coulibaly was active and aggressive on offense. The Wizards had success in the second half using him as an offensive initiator. He finished with 18 points, 6 rebounds, 6 assists, 2 steals and a block. He did the best job of any Washington defender against Brunson.
- Kyshawn George shot 3-7 from three-point range and had 3 assists.
- Corey Kispert converted inside to have a solid overall game despite 1-6 three-point shooting.
- Alex Sarr battled through early foul trouble and a poor shooting night (3-10 from the floor) to contribute 5 assists and a big-time defensive stop on New York’s final possession of regulation (a failed lob from Brunson to Karl-Anthony Towns).
Of note: Jordan Poole (hip contusion) joined Kyle Kuzma (ribs) on the sidelines for this one.
Also of note: Keefe had the Wizards on a tight rotation — just eight players. Knicks head coach Tom Thibodeau played nine total, but just seven in the second half.
Four Factors
Below are the four factors that decide wins and losses in basketball — shooting (efg), rebounding (offensive rebounds), ball handling (turnovers), fouling (free throws made).
Stats & Metrics
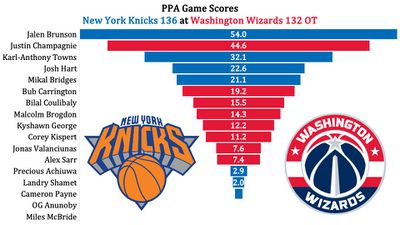
Below are a few performance metrics, including the Player Production Average (PPA) Game Score. PPA is my overall production metric, which credits players for things they do that help a team win (scoring, rebounding, playmaking, defending) and dings them for things that hurt (missed shots, turnovers, bad defense, fouls).
Game Score (GmSC) converts individual production into points on the scoreboard. The scale is the same as points and reflects each player’s total contributions for the game. The lowest possible GmSC is zero.
PPA is a per possession metric designed for larger data sets. In small sample sizes, the numbers can get weird. In PPA, 100 is average, higher is better and replacement level is 45. For a single game, replacement level isn’t much use, and I reiterate the caution about small samples sometimes producing weird results.
POSS is the number of possessions each player was on the floor in this game.
ORTG = offensive rating, which is points produced per individual possessions x 100. League average last season was 114.8. Points produced is not the same as points scored. It includes the value of assists and offensive rebounds, as well as sharing credit when receiving an assist.
USG = offensive usage rate. Average is 20%.
ORTG and USG are versions of stats created by former Wizards assistant coach Dean Oliver and modified by me. ORTG is an efficiency measure that accounts for the value of shooting, offensive rebounds, assists and turnovers. USG includes shooting from the floor and free throw line, offensive rebounds, assists and turnovers.
+PTS = “Plus Points” is a measure of the points gained or lost by each player based on their efficiency in this game compared to league average efficiency on the same number of possessions. A player with an offensive rating (points produced per possession x 100) of 100 who uses 20 possessions would produce 20 points. If the league average efficiency is 114, the league — on average — would produced 22.8 points in the same 20 possessions. So, the player in this hypothetical would have a +PTS score of -2.8.

