Stats, commentary, analysis.
With an opportunity to steal a win against a Milwaukee Bucks team missing Giannis Antetokounmpo and Damian Lillard, the Washington Wizards trailed by double digits for the final 20 minutes of the game, trailed by as much as 26, and made one of those late-game runs to slash the final margin to 11 points.
The Wizards got wrecked by Bobby Portis, who had 34 points, 10 rebounds, and a career-high 8 assists in just 32 minutes. Portis added three steals and a block and knocked down 6-9 from deep.
Khris Middleton, working his way back from extended injury absence, had his best game of the season — 18 points, 6 boards, 8 assists in just 24 minutes. The Bucks were +31 when he was on the floor.
Washington wasn’t close in this one despite shooting 42.9% on threes (18-42) and getting to the line three times as frequently as the Bucks. Their biggest failing — 19 turnovers against a team that doesn’t force them (the Bucks entered last night’s game 26th in defensive turnover percentage). The primary culprit was Jordan Poole, who committed 7 — a turnover rate of 27.6%. Average this season is 13.1%.
Bright spots?
- Bilal Coulibaly had an efficient night — 20 points on 13 shots, 11 rebounds, 5 assists, 3 steals, and a block. He attacked several times with fast and strong penetration. That’s an encouraging sign from him.
- In his second game back from an ankle injury, Corey Kispert knocked down shots again. Last night: 16 points on 8 shots, including 3-5 from deep.
- Alex Sarr had some terrible moments (like getting blown by and dunked on by Ryan Rollins), but he also shot 3-6 from three-point range and notched three assists and two steals. I feel like I remember a block, but it may have been classified as a steal by the official scorer.
- Jonas Valanciunas gave Milwaukee some trouble inside, though he diminished his overall efficiency with a pair of bricked threes. He did contribute six rebounds and three assists.
The not so good?
- Poole made shots (at least early) but played an incoherent and out of control game the rest of the way. Despite connecting on 8-13 from three point range, his offensive rating (points produced per possession x 100) was 92, which is terrible. That’s because of the 7 turnovers, zero offensive rebounds, and three assists. His defensive effort was lackluster until the last five minutes of the game when the loss was already assured.
- Malcolm Brogdon looked glacial out there, and not in the sense of being strong and immovable. He shot 2-10 from the floor and had three assists to three turnovers. The Wizards were -21 in his 24 minutes.
Four Factors
Below are the four factors that decide wins and losses in basketball — shooting (efg), rebounding (offensive rebounds), ball handling (turnovers), fouling (free throws made).
Stats & Metrics
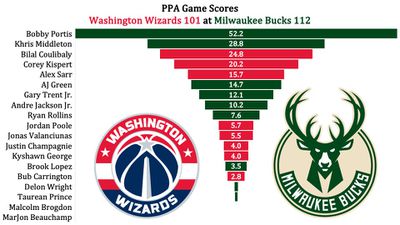
Below are a few performance metrics, including the Player Production Average (PPA) Game Score. PPA is my overall production metric, which credits players for things they do that help a team win (scoring, rebounding, playmaking, defending) and dings them for things that hurt (missed shots, turnovers, bad defense, fouls).
Game Score (GmSC) converts individual production into points on the scoreboard. The scale is the same as points and reflects each player’s total contributions for the game. The lowest possible GmSC is zero.
PPA is a per possession metric designed for larger data sets. In small sample sizes, the numbers can get weird. In PPA, 100 is average, higher is better and replacement level is 45. For a single game, replacement level isn’t much use, and I reiterate the caution about small samples sometimes producing weird results.
POSS is the number of possessions each player was on the floor in this game.
ORTG = offensive rating, which is points produced per individual possessions x 100. League average last season was 114.8. Points produced is not the same as points scored. It includes the value of assists and offensive rebounds, as well as sharing credit when receiving an assist.
USG = offensive usage rate. Average is 20%.
ORTG and USG are versions of stats created by former Wizards assistant coach Dean Oliver and modified by me. ORTG is an efficiency measure that accounts for the value of shooting, offensive rebounds, assists and turnovers. USG includes shooting from the floor and free throw line, offensive rebounds, assists and turnovers.
+PTS = “Plus Points” is a measure of the points gained or lost by each player based on their efficiency in this game compared to league average efficiency on the same number of possessions. A player with an offensive rating (points produced per possession x 100) of 100 who uses 20 possessions would produce 20 points. If the league average efficiency is 114, the league — on average — would produced 22.8 points in the same 20 possessions. So, the player in this hypothetical would have a +PTS score of -2.8.

