Stats, analysis, commentary.
The Washington Wizards gave the New York Knicks another tough game — at least for the first two-and-a-half quarters — but were overwhelmed in the third and fourth quarters en route to a 126-106 loss.
The final margin of this one was more like what the full season numbers would have suggested. The Knicks have been been 16-17 points per game better than the Wizards this year, and that difference showed in the second half.
Still, the Wizards can take some encouragement from staying close to the Knicks over the course of seven-ish quarters of basketball, including overtime and the first part of the third quarter. Unfortunately, the bigger the sample, the more the talent differential shows, and the Knicks have a lot more talent than the Wizards do.
That’s not an insult — Washington is at the start of a rebuild. Much of their talent acquisition lies in the future. The Knicks are trying to win now. And they’re succeeding — 23-10 record, the NBA’s sixth best adjusted scoring margin, third place in the Eastern Conference.
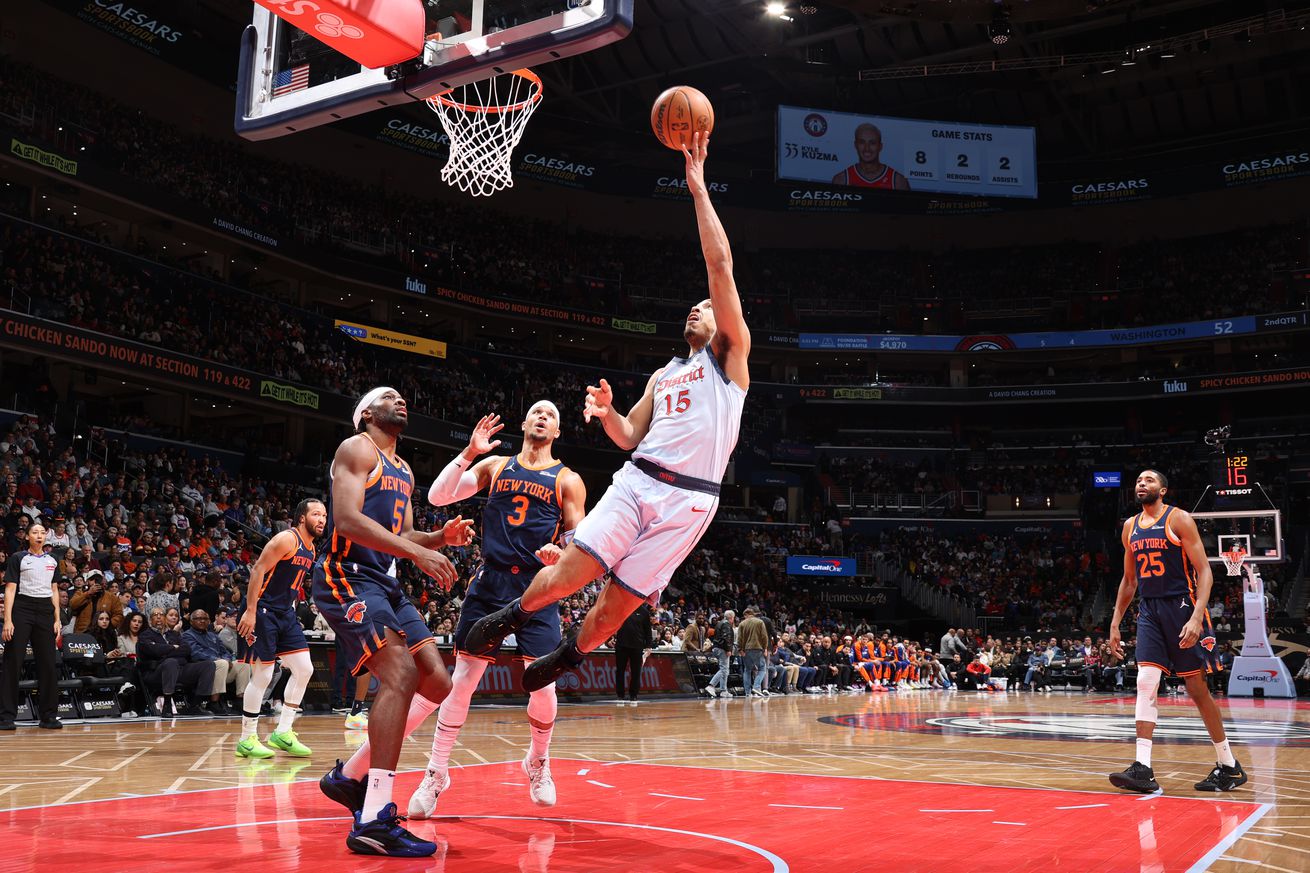
Kyle Kuzma saw his first game action since injuring his ribs Nov. 27 in the team’s loss to the Los Angeles Clippers. He missed a dozen games.
Bright spots?
- The team’s oldsters played well. Malcolm Brogdon scored 18 points on 11 shots (he was 7-7 from the free throw line), and had 6 rebounds, 7 assists, 2 steals, and just 2 turnovers. Jonas Valanciunas mashed the Knicks inside, going for 22 points in 21 minutes on 10-13 shooting. He added eight rebounds.
- Corey Kispert made shots — 6-10 from the floor and 3-6 from deep. He had a couple nice lefty finishes on drives to the basket.
- Bub Carrington played a decent game that included a couple nice moves into made threes, as well as 5 rebounds and 5 assists (to zero turnovers) before getting elbowed to the ground by OG Anunoby, taking a knee from Precious Achiuwa as he fell, and cracking the back of his head on the floor. He left the game with what the team called a “post-traumatic headache,” which is almost surely a concussion. The Athletic’s Josh Robbins reported that Carrington was talking with teammates and appeared to be okay in the locker room after the game.
- Alex Sarr hit 3-6 from three-point range and had a terrific block on a Karl-Anthony Towns at-rim put-back attempt.
- Bilal Coulibaly shot just 1-10 but contributed 3 blocks (including two on Knicks star Jalen Brunson) and had 6 assists to 2 turnovers. Even in a bad game, he found ways to contribute.
- A cool thing over the past couple games was seeing Sarr and Coulibaly successfully execute scram switches to get the bigger Sarr in position to defend Towns in the post. Also good to see: the Wizards not giving up the switch when the Knicks ran fake screen actions. In the previous matchup, the Wizards made that switch, which resulted in Brunson getting to attack George or another defender less effective than Coulibaly.
- One game after the best performance of his career, Justin Champagnie turned in one of his worst — 1-8 from the floor, 1-6 from deep and some highly questionable dribble-drive decisions (such as attacking elite defender OG Anunoby when he could have passed to Sarr wide open at the three-point line) — but he also contributed 8 defensive rebounds, a steal and two blocks.
- Knicks forward Josh Hart posted a triple-double — 23 points, 15 rebounds, 10 assists (and a couple steals). This was Hart’s 9th triple-double. Interestingly, all of Hart’s career triple-doubles have occurred in the 2024 calendar year.
Kuzma’s return doesn’t qualify for the “bright spots” list. He made his first couple shots and things got rough from there. He finished the night with 9 points on 4-9 shooting. He was 0-3 from three-point range, 1-4 on free throws, and had 3 rebounds, 3 assists, a steal, 2 turnovers and 3 fouls. His offensive rating was 82 (very bad — average this season is 113.2) on a 26.1% usage rate.
Of note, the Wizards “lost” each of the four factors that decide who wins and loses. The Knicks shot better, had more offensive rebounds, committed fewer turnovers, and made more free throws.
Four Factors
Below are the four factors that decide wins and losses in basketball — shooting (efg), rebounding (offensive rebounds), ball handling (turnovers), fouling (free throws made).
Stats & Metrics
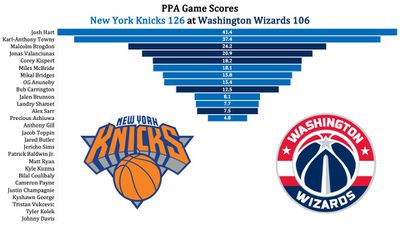
Below are a few performance metrics, including the Player Production Average (PPA) Game Score. PPA is my overall production metric, which credits players for things they do that help a team win (scoring, rebounding, playmaking, defending) and dings them for things that hurt (missed shots, turnovers, bad defense, fouls).
Game Score (GmSC) converts individual production into points on the scoreboard. The scale is the same as points and reflects each player’s total contributions for the game. The lowest possible GmSC is zero.
PPA is a per possession metric designed for larger data sets. In small sample sizes, the numbers can get weird. In PPA, 100 is average, higher is better and replacement level is 45. For a single game, replacement level isn’t much use, and I reiterate the caution about small samples sometimes producing weird results.
POSS is the number of possessions each player was on the floor in this game.
ORTG = offensive rating, which is points produced per individual possessions x 100. League average last season was 114.8. Points produced is not the same as points scored. It includes the value of assists and offensive rebounds, as well as sharing credit when receiving an assist.
USG = offensive usage rate. Average is 20%.
ORTG and USG are versions of stats created by former Wizards assistant coach Dean Oliver and modified by me. ORTG is an efficiency measure that accounts for the value of shooting, offensive rebounds, assists and turnovers. USG includes shooting from the floor and free throw line, offensive rebounds, assists and turnovers.
+PTS = “Plus Points” is a measure of the points gained or lost by each player based on their efficiency in this game compared to league average efficiency on the same number of possessions. A player with an offensive rating (points produced per possession x 100) of 100 who uses 20 possessions would produce 20 points. If the league average efficiency is 114, the league — on average — would produced 22.8 points in the same 20 possessions. So, the player in this hypothetical would have a +PTS score of -2.8.

