Stats, analysis, commentary.
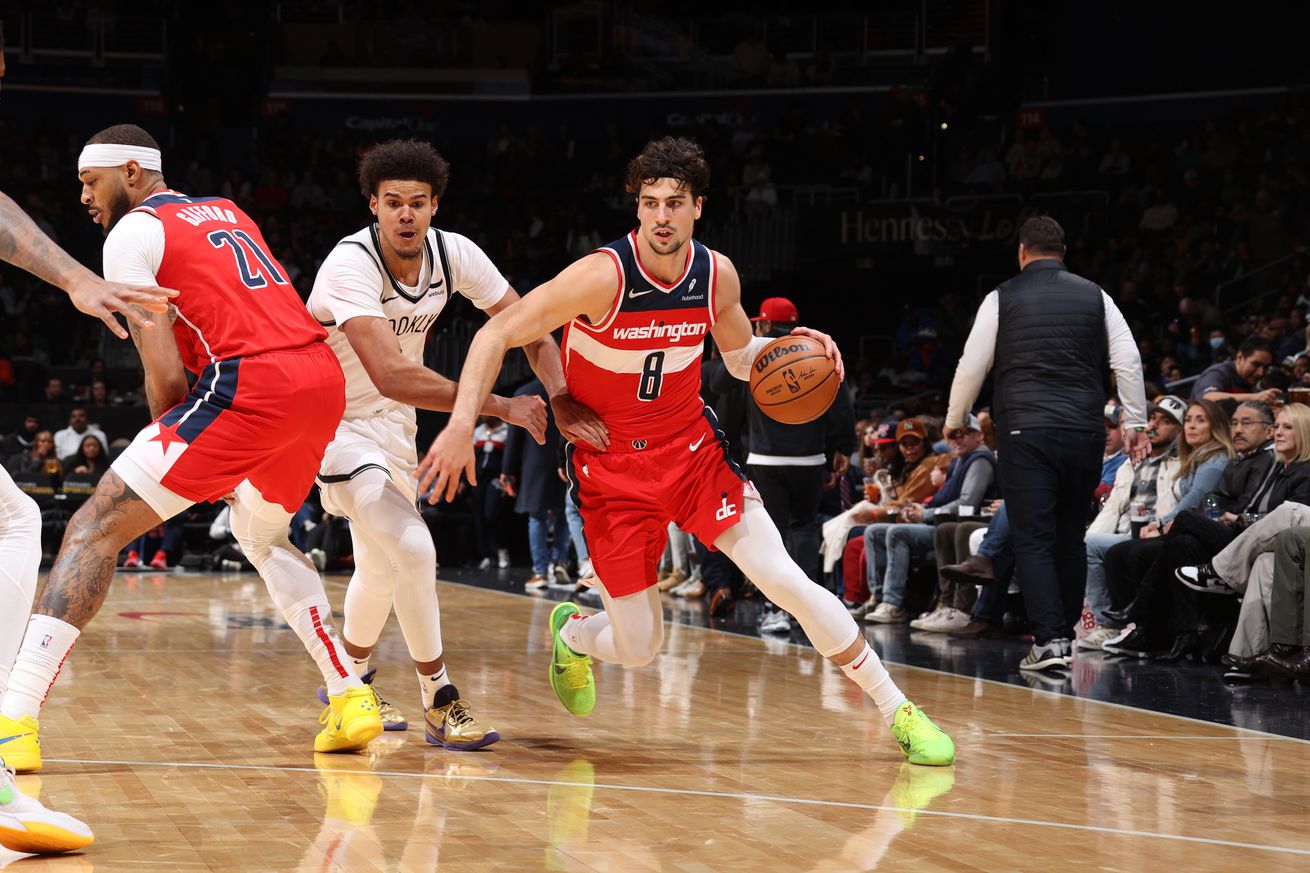
The Wizards made shots, avoided turnovers and found a group in the second half willing to defend, and that was enough to get their third home win of the season, 110-104 over the Brooklyn Nets.
Towards the end of the third quarter, and then into the fourth, lineups including Delon Wright, Landry Shamet, Corey Kispert, Bilal Coulibaly, Deni Avdija, and Mike Muscala were downright suffocating. Brooklyn struggled to get good shots, and their offense often degenerated into iso moves into difficult shots — often fading away to have a hope of getting the shot off at all.
Credit to Wes Unseld Jr. for sticking with that group beyond their usual rotation. The defense remained stout when he subbed in Tyus Jones and Kyle Kuzma to close the game. Notably, Jordan Poole and Daniel Gafford did not play in the final period.
Washington surely benefited from some good luck as well. The Nets got to the free throw line 27 times to Washington’s 7. Brooklyn entered the game a little below average in team free throw shooting (76.9% on the year; league average is 78.7%) but made just 17 in DC (62.9%).
Musings & Observations
- Excellent game from Deni Avdija: 21 points, 13 rebounds, 6 assists, and just 1 turnover. He defended effectively, hit 3-5 from three, and the team even ran a play for him — a pin-in to get him an open look from the corner, which he drained.
- Good performance from Kyle Kuzma — 26 points and 8 rebounds in 31 minutes. His overall offensive efficiency left a bit to be desired, but was good enough to deliver genuine value.
- Another steady and hyper-efficient game from Tyus Jones — 12 points, 4 rebounds, 6 assists, and zero turnovers. He shot 6-9 from the floor for an offensive rating (points produced per possession used x 100) of 153.
- Delon Wright made his shots (2-3 from the floor) and had a couple assists, but made his biggest impact on the defensive end. He came up with 2 steals, and the team was +18 in his 17 minutes of playing time. A contending team with smart management should be working to pry him out of Washington.
- Corey Kispert hunted shots, and the Nets acted like him getting the ball at the three-point line was an emergency. Somehow, he had zero rebounds, assists, steals, blocks, or turnovers in 17 minutes of playing time. He was part of team’s stellar second half defensive group.
- Mike Muscala had his best game in Washington, and it was critical to the team’s victory because Daniel Gafford had one of his worst.
- Bilal Coulibaly crashed the boards, missed a pull up jumper, drove to the rim for a layup, and dunked on a nice cut-and-feed from Kuzma. It’d be nice if the coaches could figure out how to involve him in their offense, but his floor game and defense are good.
- Jordan Poole was terrible (again) when he was on the floor — 5 points on 2-6 shooting, no rebounds, steals or blocks, 5 assists, 1 turnover, and 4 fouls in 25 minutes. The team was -16 and an utter dumpster fire on defense with him in the game.
- The Wizards once again got their teeth kicked in on the boards. Brooklyn had 18 offensive rebounds to Washington’s 8, and won the overall rebounding battle, 54-43. Good thing for the Wizards the Nets couldn’t shoot straight.
- The game ran at a glacial pace — just 92 possessions per team. Washington came into the game averaging a league-high pace of 104.0 possessions per 48 minutes. The Nets average 98.4. The two teams combined for just 14 fast break points — For Washington, it’s the slowest-paced game of the season so far.
Four Factors
Below are the four factors that decide wins and losses in basketball — shooting (efg), rebounding (offensive rebounds), ball handling (turnovers), fouling (free throws made).
Stats & Metrics
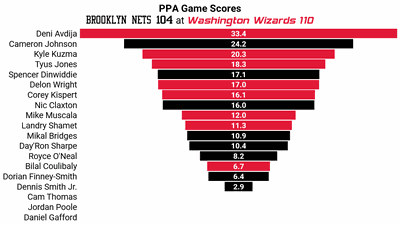
Below are a few performance metrics, including the Player Production Average (PPA) Game Score. PPA is my overall production metric, which credits players for things they do that help a team win (scoring, rebounding, playmaking, defending) and dings them for things that hurt (missed shots, turnovers, bad defense, fouls).
Game Score (GmSC) converts individual production into points on the scoreboard. The scale is the same as points and reflects each player’s total contributions for the game. The lowest possible GmSC is zero.
PPA is a per possession metric designed for larger data sets. In small sample sizes, the numbers can get weird. In PPA, 100 is average, higher is better and replacement level is 45. For a single game, replacement level isn’t much use, and I reiterate the caution about small samples sometimes producing weird results.
POSS is the number of possessions each player was on the floor in this game.
ORTG = offensive rating, which is points produced per individual possessions x 100. League average last season was 114.8. Points produced is not the same as points scored. It includes the value of assists and offensive rebounds, as well as sharing credit when receiving an assist.
USG = offensive usage rate. Average is 20%.
ORTG and USG are versions of stats created by Wizards assistant coach Dean Oliver and modified by me. ORTG is an efficiency measure that accounts for the value of shooting, offensive rebounds, assists and turnovers. USG includes shooting from the floor and free throw line, offensive rebounds, assists and turnovers.
+PTS = “Plus Points” is a measure of the points gained or lost by each player based on their efficiency in this game compared to league average efficiency on the same number of possessions. A player with an offensive rating (points produced per possession x 100) of 100 who uses 20 possessions would produce 20 points. If the league average efficiency is 114, the league — on average — would produced 22.8 points in the same 20 possessions. So, the player in this hypothetical would have a +PTS score of -2.8.

