Stats, commentary, analysis
The Washington Wizards rode hot shooting in the second half and an abundance of bungling by the Bulls to get their biggest win of the season — an 18-point romp over Chicago.
Washington got contributions from across the roster in getting their sixth win of the season. The results have been better over the past 10-11 games. Opponents have shot below 32% on threes in recent weeks, including the Bulls — 14-47, 29.8% last night against the Wizards.
Chicago also committed 20 turnovers — significantly more than their norm.
Bright spots?
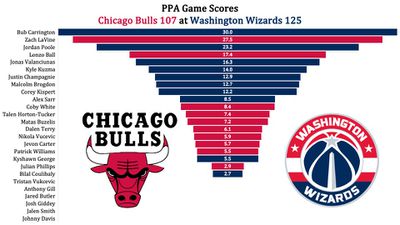
- Bub Carrington was in the starting lineup and missed no games after taking a nasty fall and cracking his head on the floor against the New York Knicks. Even better — Carrington was terrific. He scored 11 points on just 5 shots, and contributed 4 rebounds, 6 assists, a steal and a block and zero turnovers. He led the Wizards in PPA (see below) and Game Score (see below) despite just 7.8% usage. His offensive rating: 223. Wow.
- Jordan Poole returned from missing a couple games with a hip contusion to score 30, including 18 in the second half. He hit 6-13 from three, including an extreme range bomb and a couple step-backs. He made few hustle plays on defense (three steals), which helped offset his five turnovers.
- Jonas Valanciunas was inefficient on offense (6-12 from the floor with 4 turnovers), but he had 6 rebounds, 6 assists, and 3 steals in 22 minutes.
- Kyle Kuzma took just three shots in 22 minutes and had a usage rate of 8.1%, and he was very good. He finished with 5 points, 5 rebounds, 5 assists and zero turnovers.
- Justin Champagnie bounced back from a poor game against the Knicks to score 15 points on 8 shots in 21 minutes.
- Corey Kispert hit shots again — 3-6 from deep.
- Alex Sarr had 10 points, 11 rebounds, 5 assists and a block. Not elite numbers by any stretch, but a competent professional game with just two turnovers and one foul.
- It was great to see Lonzo Ball back on the court making good plays. He missed two full seasons and most of a third recovering from a knee injury that required multiple surgeries, including an experimental cartilage transplant. When he got hurt in 2022, Chicago was 19-10 and in second place in the Eastern Conference.
Bilal Coulibaly exited the game with a non-COVID illness about 9 minutes into the game and didn’t return. I’d anticipate him being available Friday against the New Orleans Pelicans.
By the way, Washington’s next two games are against New Orleans, which has a league worst 5-29 record (they lost against last night). There’s a reasonable chance the Wizards could enter next week unbeaten in 2025 and sporting their first three-game winning streak.
As for the Bulls, they’re a franchise on the NBA’s dreaded treadmill of mediocrity (much like the Wizards were before GM Will Dawkins and company traded off Bradley Beal and launched a rebuild). It’s been 10 seasons since Chicago won 50 games, and they have just two postseason appearances to show for the decade.
They have a few veterans like Nikola Vucevic (having his best season in years at age 34) and Zach LaVine (a solid bounce back year after missing of last season with an injury), as well as young and reasonably productive veterans (Coby White and Ayo Dosunmu), who at least theoretically should draw trade interest from contending teams. But the Bulls keep slogging away as they “contend” for the play-in.
The strategy of hanging on to veterans and refusing to bottom out isn’t necessarily a bad one. Building a title contender is difficult, and it’s probably as reasonable for an owner or front office executive to think they could draft a franchise player with a mid-first round pick as it is to think they could end up with the number one pick in the draft by having the league’s worst record. And they get to avoid the perils of mis-calibrating how much “tearing down” is necessary and inadvertently prolonging the rebuild.
If the Wizards front office is serious about trading Valanciunas, they should probably make the move before the Bulls decide to punt this season by dealing Vucevic. Destinations for the teams are likely to be similar, and the team that moves second could end up having to wait until the offseason.
Four Factors
Below are the four factors that decide wins and losses in basketball — shooting (efg), rebounding (offensive rebounds), ball handling (turnovers), fouling (free throws made).
Stats & Metrics
Below are a few performance metrics, including the Player Production Average (PPA) Game Score. PPA is my overall production metric, which credits players for things they do that help a team win (scoring, rebounding, playmaking, defending) and dings them for things that hurt (missed shots, turnovers, bad defense, fouls).
Game Score (GmSC) converts individual production into points on the scoreboard. The scale is the same as points and reflects each player’s total contributions for the game. The lowest possible GmSC is zero.
PPA is a per possession metric designed for larger data sets. In small sample sizes, the numbers can get weird. In PPA, 100 is average, higher is better and replacement level is 45. For a single game, replacement level isn’t much use, and I reiterate the caution about small samples sometimes producing weird results.
POSS is the number of possessions each player was on the floor in this game.
ORTG = offensive rating, which is points produced per individual possessions x 100. League average last season was 114.8. Points produced is not the same as points scored. It includes the value of assists and offensive rebounds, as well as sharing credit when receiving an assist.
USG = offensive usage rate. Average is 20%.
ORTG and USG are versions of stats created by former Wizards assistant coach Dean Oliver and modified by me. ORTG is an efficiency measure that accounts for the value of shooting, offensive rebounds, assists and turnovers. USG includes shooting from the floor and free throw line, offensive rebounds, assists and turnovers.
+PTS = “Plus Points” is a measure of the points gained or lost by each player based on their efficiency in this game compared to league average efficiency on the same number of possessions. A player with an offensive rating (points produced per possession x 100) of 100 who uses 20 possessions would produce 20 points. If the league average efficiency is 114, the league — on average — would produced 22.8 points in the same 20 possessions. So, the player in this hypothetical would have a +PTS score of -2.8.

