Stats, analysis, commentary
After this one ended, I spent some time staring at the numbers while pondering two questions:
- If a hypothetical NBA coach was given the Wizards roster and asked to win a game to save a loved one’s life, who would he play? And,
- Would it make any difference?
Such is the state of the Washington Wizards, that I went through a few permutations trying to answer #1, and then said F it because of the answer to #2. Michael Winger, Will Dawkins, and Travis Schlenk have largely coach proofed the player personnel. Maybe one day some of the youngsters will be good. But that’s not the case today, and it won’t be until some indeterminate point in the future.
Maybe older players could contribute to good teams in different roles. But those roles don’t exist on this team because of the utter lack of talent.
What’s left is a team that took on a weak Chicago Bulls team that came to DC ranked 18th in offense and 28th in defense, and was unable to slow Chicago’s attack or generate points.
This Wizards squad has been so bad this season that it’s competing with history. They’re currently tied (with the 1947-48 Providence Steamrollers) for the fourth worst winning percentage ever. They have the third worst adjusted scoring margin in history. By the end of the season, they could well be at the all-time bottom in each of these categories, especially if they trade some of the vets.
Also, in the last two Playbacks, I discussed renaming the Wizards — first with Gabe Ibrahim, and then with Albert Lee. It would be difficult to find a better new name than Steamrollers. Just saying.
So, bright spots from Washington’s 127-108 loss to the Chicago Bulls?
- They didn’t lose by 20.
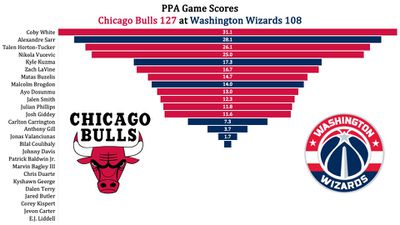
- Alex Sarr, the 19-year-old rookie center, who was the number two overall pick in this year’s draft, played well — 20 points, 7 rebounds, 3 assists, a steal, and a block. He knocked down 4-5 from three-point range, raising his three-point percentage for the year to 24.2%.
- 51.5% of the team’s minutes went to players 20 years of age or younger.
- Kyle Kuzma was okay.
- Malcolm Brogdon was okay.
- Anthony Gill was okay?
That’s about all I got, unless we want to talk about guys trying hard or garbage time production.
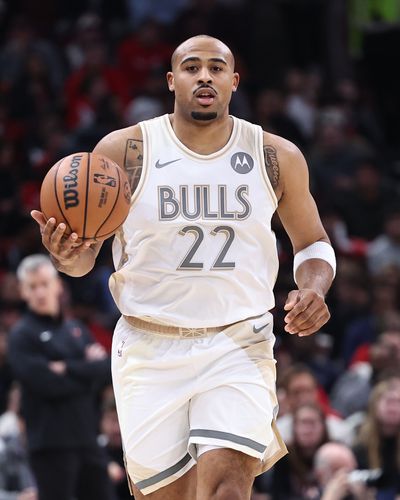
I mean, this Wizards team got toasted by a version of Talen Horton-Tucker — a minimum salary guy trying to hang on for a few more paydays — who now resembles a slower, stiffer, less explosive, less muscular Ledell Eackles. (Don’t argue: Horton-Tucker scored 13 points on 6 shots. He had two assists, a steal and a block. His offensive rating was 188. League average is 113.3.)
Also:

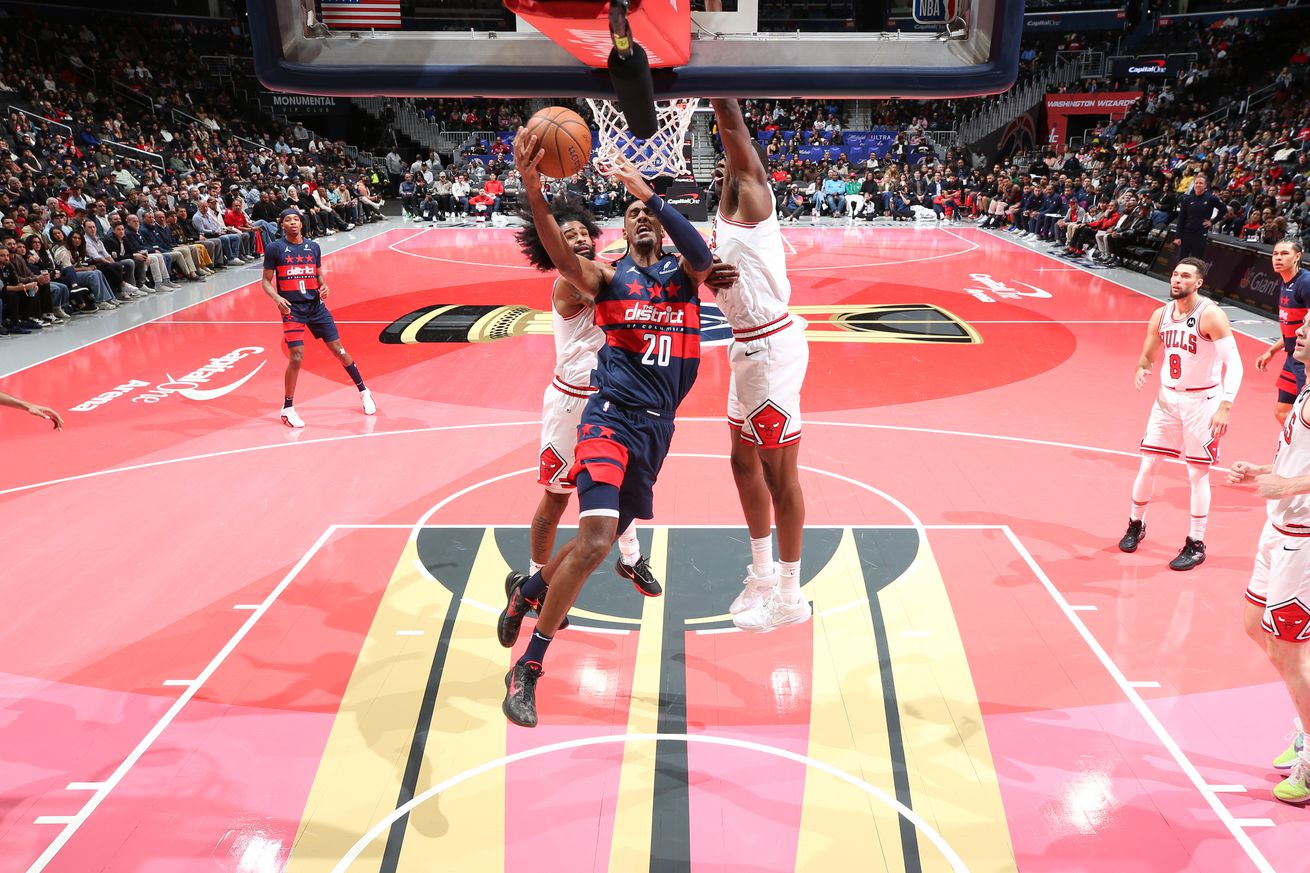
Photo by Geoff Stellfox/Getty Images
Four Factors
Below are the four factors that decide wins and losses in basketball — shooting (efg), rebounding (offensive rebounds), ball handling (turnovers), fouling (free throws made).
Stats & Metrics
Below are a few performance metrics, including the Player Production Average (PPA) Game Score. PPA is my overall production metric, which credits players for things they do that help a team win (scoring, rebounding, playmaking, defending) and dings them for things that hurt (missed shots, turnovers, bad defense, fouls).
Game Score (GmSC) converts individual production into points on the scoreboard. The scale is the same as points and reflects each player’s total contributions for the game. The lowest possible GmSC is zero.
PPA is a per possession metric designed for larger data sets. In small sample sizes, the numbers can get weird. In PPA, 100 is average, higher is better and replacement level is 45. For a single game, replacement level isn’t much use, and I reiterate the caution about small samples sometimes producing weird results.
POSS is the number of possessions each player was on the floor in this game.
ORTG = offensive rating, which is points produced per individual possessions x 100. League average last season was 114.8. Points produced is not the same as points scored. It includes the value of assists and offensive rebounds, as well as sharing credit when receiving an assist.
USG = offensive usage rate. Average is 20%.
ORTG and USG are versions of stats created by former Wizards assistant coach Dean Oliver and modified by me. ORTG is an efficiency measure that accounts for the value of shooting, offensive rebounds, assists and turnovers. USG includes shooting from the floor and free throw line, offensive rebounds, assists and turnovers.
+PTS = “Plus Points” is a measure of the points gained or lost by each player based on their efficiency in this game compared to league average efficiency on the same number of possessions. A player with an offensive rating (points produced per possession x 100) of 100 who uses 20 possessions would produce 20 points. If the league average efficiency is 114, the league — on average — would produced 22.8 points in the same 20 possessions. So, the player in this hypothetical would have a +PTS score of -2.8.
