Stats, commentary, analysis.
Against the NBA’s top offense entering last night’s game, the Wizards paired terrible offense throughout and stellar defense in the second half en route to a 14-point loss to the Boston Celtics.
In the first half, Boston shot 43% on threes, had a 130 offensive rating, and built a 15-point lead. The game had all the signs of another rout, but the Wizards played their best defensive half of the season, limiting the Celtics to 45 second-half points and a paltry 90 ortg.
I’m generally cautious about over-crediting a team for a good defensive half, or even a game. For example, a few days ago, the Cleveland Cavaliers had a subpar offensive game and a poor shooting night from three-point range. That wasn’t because Washington defended well — Cleveland just missed shots they’ve made most of the season.
Any time I see an aberrant defensive (or offensive) performance, my first look is at three point shooting. Sometimes a good result is nothing more than being fortunate enough to be on the court when the other team suffers through some random variance.
I don’t think that was the case — at least not completely — against Boston. For one thing, the Celtics shot 36.0% from three-point range. For the season, they’re shooting 37.1%. That’s perfectly normal shooting for them. For the game, they shot 39.1%.
While there was still likely some luck, to my eye, the Wizards actually defended well in the second half. They made Boston work to get shots, they harassed ball handlers (13 second half turnovers), and even cut back on the fouling (11 second half fouls to 14 in the first).
One potential flaw in my sense that the Wizards deserve a solid helping of credit for their second half defense: they trailed by 15-20 points for most of the fourth quarter, and they may have benefited a bit from the Celtics succumbing to what Dean Oliver called “the slacking off effect.” Basically, that means that a team with a big lead doesn’t play quite as hard because their goal is not necessarily to maximize the final margin but simply to win the game.
Anyway, Boston got the win despite subpar games from stars Jayson Tatum and Jaylen Brown, as well as a first half injury that sidelined formers Wizards center Kristaps Porzingis. The Celtics won because of stellar performances by Derrick White and a bench mob of Sam Hauser, Payton Pritchard, and Luke Kornet.
How bad was Washington’s offense? They shot 32.5% from three-point range, which is a) poor, and b) a slight improvement on their 31.4% shooting from deep so far this season. The Wizards connected on just 45.8% on twos, shot just 5-8 from the free throw line, and committed 16 turnovers. That’s a rough night.
Head coach Brian Keefe, who expressed frustration with the officiating after the team’s loss to the Cleveland Cavaliers got hit with a technical foul after yelling at refs last night. The Wizards have been whistled for the fourth most fouls per 100 possessions so far this season.
I suspect that’s because of their youth and frequent breakdowns, which lead to more scrambling than most other teams do. The disorganization and blown assignments lead to reach, hacking and grabbing opponents, all of which are things that tend to be called fouls. The team’s leading foul committers skew young and inexperienced:
- Kyshawn George, 5.6 fouls per 100 team possessions
- Jared Butler, 5.2
- Jordan Poole, 5.2
- Bub Carrington, 5.1
- Justin Champagnie, 5.0
- Alex Sarr, 4.8
After Sarr, there’s a significant step down to Malcolm Brogdon and Johnny Davis at 4.1, and Jonas Valanciunas at 4.0. The league average individual foul rate is 3.9 per 100 team possessions.
Given that he’s played nearly 10,000 minutes and is in his sixth NBA season, Poole’s fouling shouldn’t be so high. His fouls were somewhat elevated even when he was in Golden State, but the rate has gone up significantly in Washington. Here’s his foul rate progression:
- 2019-20 — Golden State Warriors — 3.5 fouls per 100 team possessions
- 2020-21 — Golden State Warriors — 4.1
- 2021-22 — Golden State Warriors — 4.4
- 2022-23 — Golden State Warriors — 4.1
- 2023-24 — Washington Wizards — 4.9
- 2024-25 — Washington Wizards — 5.2*
That does not include last night’s game in which he fouled five times in 77 possessions.
Bright spots?
- Justin Champagnie is making a case for remaining in the rotation even when the team is at full health. Since he’s on a minimum salary, he could also be added to a potential trade to increase the draft picks the team gets back. Last night: 13 points, 14 rebounds, 3 assists, 3 steals, and 2 blocks. He was the only Wizards player with an above average offensive rating in the game.
- Bub Carrington competed hard for 40 minutes. The results weren’t great, but he did tally his second career double-double with 11 points and 10 rebounds.
- Bilal Coulibaly set a new career high with 20 field goal attempts and a 26.1% usage rate. It was his most aggressive offensive game of the season, and the second highest usage of his career (the high was 28.2%, which he did Feb. 9, 2024 against the Boston Celtics).
- Jordan Poole was part of the defensive effort, at least in the third quarter when he forced Jrue Holiday into a pair of turnovers.
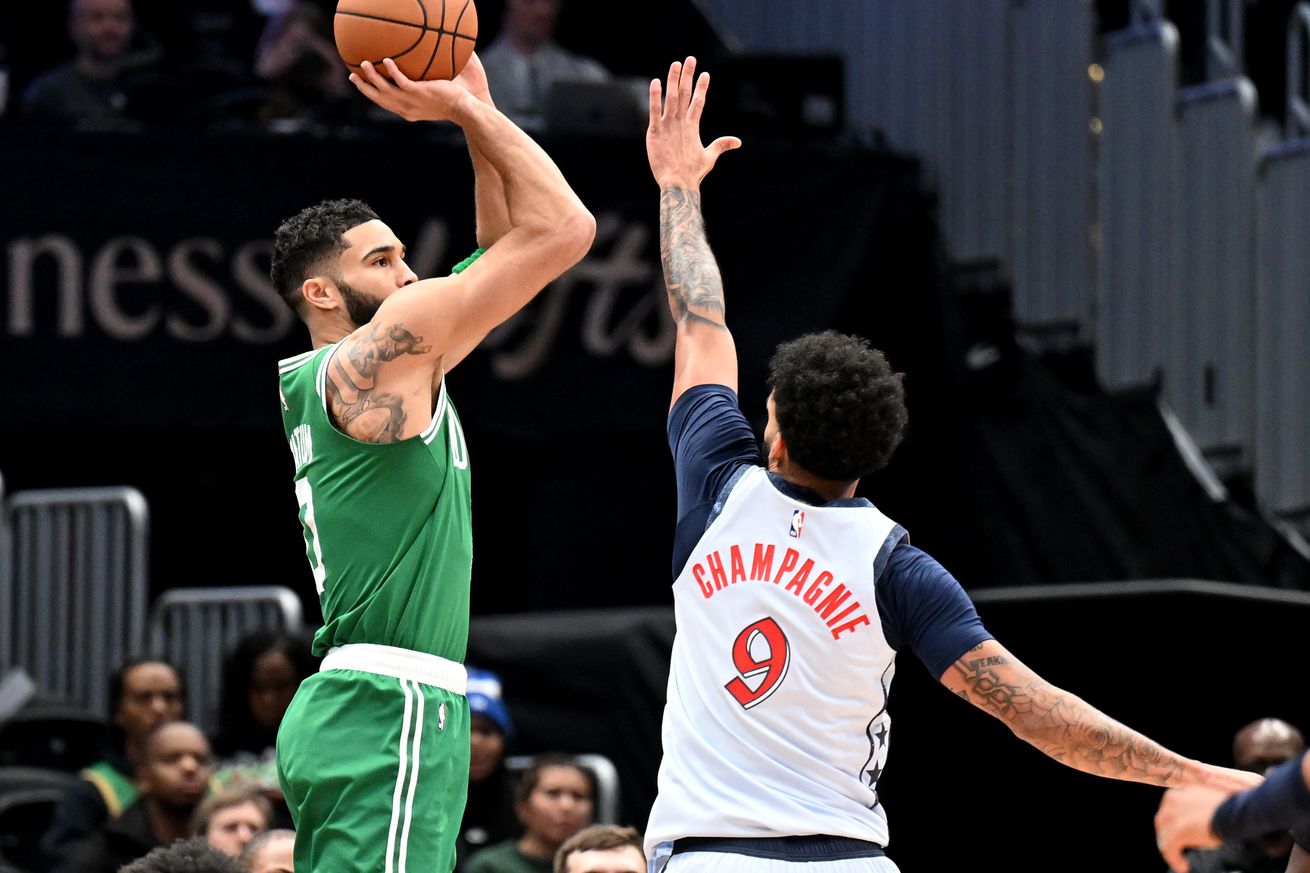
An amusement: the headline and the lede for this game on NBA.com hails Tatum for 28 points and 12 rebounds. The story fails to mention he needed 26 shots and 4 turnovers to reach those totals. Tatum’s inefficiency (ortg: 98) was one of the reasons Boston didn’t turn the game into a romp.
For the game, Tatum and Brown used 39 possessions to produce 34 points (note — points produced includes the value of assists and offensive rebounds and shares credit for points scored with teammates). That’s a combined offensive rating of 87.2. The rest of the Celtics combined to produce 78 points in 63 possessions used — a 123.7 offensive rating.
So, to loop back to my comments on Washington’s defense, yet another possible explanation is that Tatum and Brown just had bad games. (I still think the Wizards actually defended well in the second half.)
Four Factors
Below are the four factors that decide wins and losses in basketball — shooting (efg), rebounding (offensive rebounds), ball handling (turnovers), fouling (free throws made).
Stats & Metrics
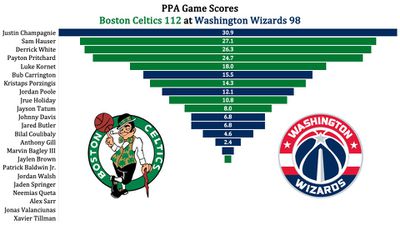
Below are a few performance metrics, including the Player Production Average (PPA) Game Score. PPA is my overall production metric, which credits players for things they do that help a team win (scoring, rebounding, playmaking, defending) and dings them for things that hurt (missed shots, turnovers, bad defense, fouls).
Game Score (GmSC) converts individual production into points on the scoreboard. The scale is the same as points and reflects each player’s total contributions for the game. The lowest possible GmSC is zero.
PPA is a per possession metric designed for larger data sets. In small sample sizes, the numbers can get weird. In PPA, 100 is average, higher is better and replacement level is 45. For a single game, replacement level isn’t much use, and I reiterate the caution about small samples sometimes producing weird results.
POSS is the number of possessions each player was on the floor in this game.
ORTG = offensive rating, which is points produced per individual possessions x 100. League average last season was 114.8. Points produced is not the same as points scored. It includes the value of assists and offensive rebounds, as well as sharing credit when receiving an assist.
USG = offensive usage rate. Average is 20%.
ORTG and USG are versions of stats created by former Wizards assistant coach Dean Oliver and modified by me. ORTG is an efficiency measure that accounts for the value of shooting, offensive rebounds, assists and turnovers. USG includes shooting from the floor and free throw line, offensive rebounds, assists and turnovers.
+PTS = “Plus Points” is a measure of the points gained or lost by each player based on their efficiency in this game compared to league average efficiency on the same number of possessions. A player with an offensive rating (points produced per possession x 100) of 100 who uses 20 possessions would produce 20 points. If the league average efficiency is 114, the league — on average — would produced 22.8 points in the same 20 possessions. So, the player in this hypothetical would have a +PTS score of -2.8.
