Stats, analysis, commentary.
I kinda want to just ignore this one. Dump it in the memory hole and delete it from memory. But writing these pieces is something of a ritual — a tradition? — and rituals/traditions can be worthwhile.
The Washington Wizards entered last night’s game 30th in strength of schedule adjusted scoring margin, 30th in offensive rating (points scored per 100 possessions), and 30th in defensive rating (points allowed per 100 possessions). Their opponent, the Cleveland Cavaliers, ranked 4th, 2nd and 6th respectively in those categories.
As would be expected, the Cavaliers delivered a thorough stomping. Cleveland led by 15 after the first quarter, went a bit cold from the floor in the second and third (meaning they led by just 18 at the half and 19 at the end of three), and then tapped the gas in the fourth quarter to coast home with a 31-point win.
Washington’s problem in this one: offense. Well, and defense too, but offense was the bigger issue. As in, the Wizards shot 4-26 from three-point range and committed 20 turnovers. Their effective field goal percentage was 41.0%. League average is 53.9%. Their offensive rating was 86.
On the defensive end, Cleveland’s relatively modest efficiency — “only” about 3.6 points per 100 possessions above average — was more attributable to the Cavaliers missing open shots they usually make than anything the Wizards accomplished.
Bright spots? Hmm…
- Jonas Valanciunas scored 13 points and grabbed 11 rebounds in 19 minutes.
- Even with Kyshawn George turning an ankle and playing just 11 minutes, head coach Brian Keefe gave 44% of the playing time to players 20 years of age or younger.
- Bilal Coulibaly had four assists, including a nifty behind-the-back dish to Valanciunas for a bucket.
- George had six rebounds in his 11 minutes of action.
- By locking down Isaac Okoro in the game’s closing minutes, Washington prevented the Cavaliers from getting eight players into double-digit scoring?
As would be expected in a 31-point drubbing, negatives were more plentiful for the Wizards.
- Jordan Poole was out of control early. He finished with 13 points on 4-11 shooting and had a whopping five turnovers and four fouls in just 24 minutes of action. His offensive rating was 77 on a 33.3% usage rate.
- Malcolm Brogdon missed shots (just 2-9 from the floor) and did almost nothing else.
- Corey Kispert and George turned their ankles. Neither returned to action.
This was Washington’s 15th consecutive defeat and lowered their record to 2-17. They have yet to win an NBA Cup game. They lost all four last season and repeated the feat this year. Their NBA Cup scoring differential this year: -74. In four games. That’s the worst mark in the league.
Tune in Thursday when they face the Dallas Mavericks for a chance to tie the franchise record for consecutive futility with a 16th straight loss.
Four Factors
Below are the four factors that decide wins and losses in basketball — shooting (efg), rebounding (offensive rebounds), ball handling (turnovers), fouling (free throws made).
Stats & Metrics
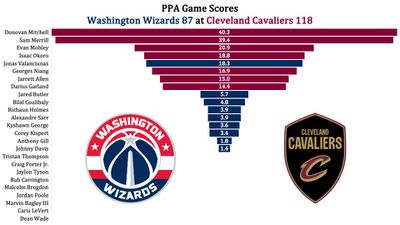
Below are a few performance metrics, including the Player Production Average (PPA) Game Score. PPA is my overall production metric, which credits players for things they do that help a team win (scoring, rebounding, playmaking, defending) and dings them for things that hurt (missed shots, turnovers, bad defense, fouls).
Game Score (GmSC) converts individual production into points on the scoreboard. The scale is the same as points and reflects each player’s total contributions for the game. The lowest possible GmSC is zero.
PPA is a per possession metric designed for larger data sets. In small sample sizes, the numbers can get weird. In PPA, 100 is average, higher is better and replacement level is 45. For a single game, replacement level isn’t much use, and I reiterate the caution about small samples sometimes producing weird results.
POSS is the number of possessions each player was on the floor in this game.
ORTG = offensive rating, which is points produced per individual possessions x 100. League average last season was 114.8. Points produced is not the same as points scored. It includes the value of assists and offensive rebounds, as well as sharing credit when receiving an assist.
USG = offensive usage rate. Average is 20%.
ORTG and USG are versions of stats created by former Wizards assistant coach Dean Oliver and modified by me. ORTG is an efficiency measure that accounts for the value of shooting, offensive rebounds, assists and turnovers. USG includes shooting from the floor and free throw line, offensive rebounds, assists and turnovers.
+PTS = “Plus Points” is a measure of the points gained or lost by each player based on their efficiency in this game compared to league average efficiency on the same number of possessions. A player with an offensive rating (points produced per possession x 100) of 100 who uses 20 possessions would produce 20 points. If the league average efficiency is 114, the league — on average — would produced 22.8 points in the same 20 possessions. So, the player in this hypothetical would have a +PTS score of -2.8.

