Stats, analysis, commentary.
The Wizards played hard and hung tough against Damian Lillard, Giannis Antetokounmpo, and the Milwaukee Bucks before fading in the fourth quarter and suffering a 14th consecutive defeat.
The veterans — Malcolm Brogdon, Jordan Poole, Corey Kispert, and Jonas Valanciunas — did much of the work in this one. The four combined to use 69 of Washington’s 100 possessions and produced 88 of their 114 points. That’s 69% of the possessions and 77% of the points. It’s also a combined offensive rating (ortg) of 128, which is very good.
The team’s future — Alex Sarr, Bilal Coulibaly, Bub Carrington, and Kyshawn George — combined to produce 22 points in 29 possessions used. That’s an ortg of 75, which is terrible.
Bright spots?
- Brogdon boosted his trade value with an efficient 29 points (he hit 10-15 from the floor, including both threes he attempted), 11 rebounds, 3 assists, and a block. He had a 155 ortg on 26.8% usage. He also had a handful of strong defensive possessions — exactly the kind that could go in a scouting highlights video as contending front offices track trade targets.
- Poole continued to make quick attack dribble penetration a staple of his game, and it’s a good thing. He’s getting to the rim, drawing fouls, and creating space to launch threes. His decision-making is still an adventure, but the results were good — 31 points and 7 assists, plus 2 steals and a block. His ortg was 112 on 38.1% usage. The 112 is okay — a shade below average. The usage is too high for him and his abilities.
- Kispert hit a couple threes and scored efficiently. He also grabbed 8 rebounds (second most in a game since entering the NBA). His PPA (see below) was “just” 124 (surprisingly low for a guy with a 139 ortg). Why? Zero assists, steals, or blocks and four fouls.
- Valanciunas banged around in the paint — 16 points, 7 rebounds, 5 assists. The team defense wasn’t bad with him in the game. He also had four turnovers and four fouls.
- Players 20 years of age or younger accounted for 45% of the team’s minutes.
What has me worried?
- Coulibaly’s 9.8% usage rate. After a decent start to the season, his offensive game has become downright passive.
- Carrington played 15 minutes, 44 seconds — the fewest he’s gotten in a game thus far in his career. The previous low was the previous game — 18:59 Nov. 27 against the Los Angeles Clippers. He hasn’t been playing well, but I hope this isn’t the start of a trend of dwindling minutes.
- Sarr was thoroughly unprepared for Giannis. While it’s expected for a player like Giannis to dominate a 19-year-old rookie like Sarr, what had me scratching my head was Sarr not being ready for basic drives. He’s too physically gifted to not even have his feet moving by the time Giannis is already launching into a dunk. The word that comes to mind for his defense against the Greek Freak: turnstile.
Four Factors
Below are the four factors that decide wins and losses in basketball — shooting (efg), rebounding (offensive rebounds), ball handling (turnovers), fouling (free throws made).
Stats & Metrics
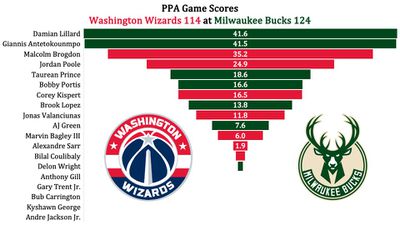
Below are a few performance metrics, including the Player Production Average (PPA) Game Score. PPA is my overall production metric, which credits players for things they do that help a team win (scoring, rebounding, playmaking, defending) and dings them for things that hurt (missed shots, turnovers, bad defense, fouls).
Game Score (GmSC) converts individual production into points on the scoreboard. The scale is the same as points and reflects each player’s total contributions for the game. The lowest possible GmSC is zero.
PPA is a per possession metric designed for larger data sets. In small sample sizes, the numbers can get weird. In PPA, 100 is average, higher is better and replacement level is 45. For a single game, replacement level isn’t much use, and I reiterate the caution about small samples sometimes producing weird results.
POSS is the number of possessions each player was on the floor in this game.
ORTG = offensive rating, which is points produced per individual possessions x 100. League average last season was 114.8. Points produced is not the same as points scored. It includes the value of assists and offensive rebounds, as well as sharing credit when receiving an assist.
USG = offensive usage rate. Average is 20%.
ORTG and USG are versions of stats created by former Wizards assistant coach Dean Oliver and modified by me. ORTG is an efficiency measure that accounts for the value of shooting, offensive rebounds, assists and turnovers. USG includes shooting from the floor and free throw line, offensive rebounds, assists and turnovers.
+PTS = “Plus Points” is a measure of the points gained or lost by each player based on their efficiency in this game compared to league average efficiency on the same number of possessions. A player with an offensive rating (points produced per possession x 100) of 100 who uses 20 possessions would produce 20 points. If the league average efficiency is 114, the league — on average — would produced 22.8 points in the same 20 possessions. So, the player in this hypothetical would have a +PTS score of -2.8.

