Stats, analysis, commentary.
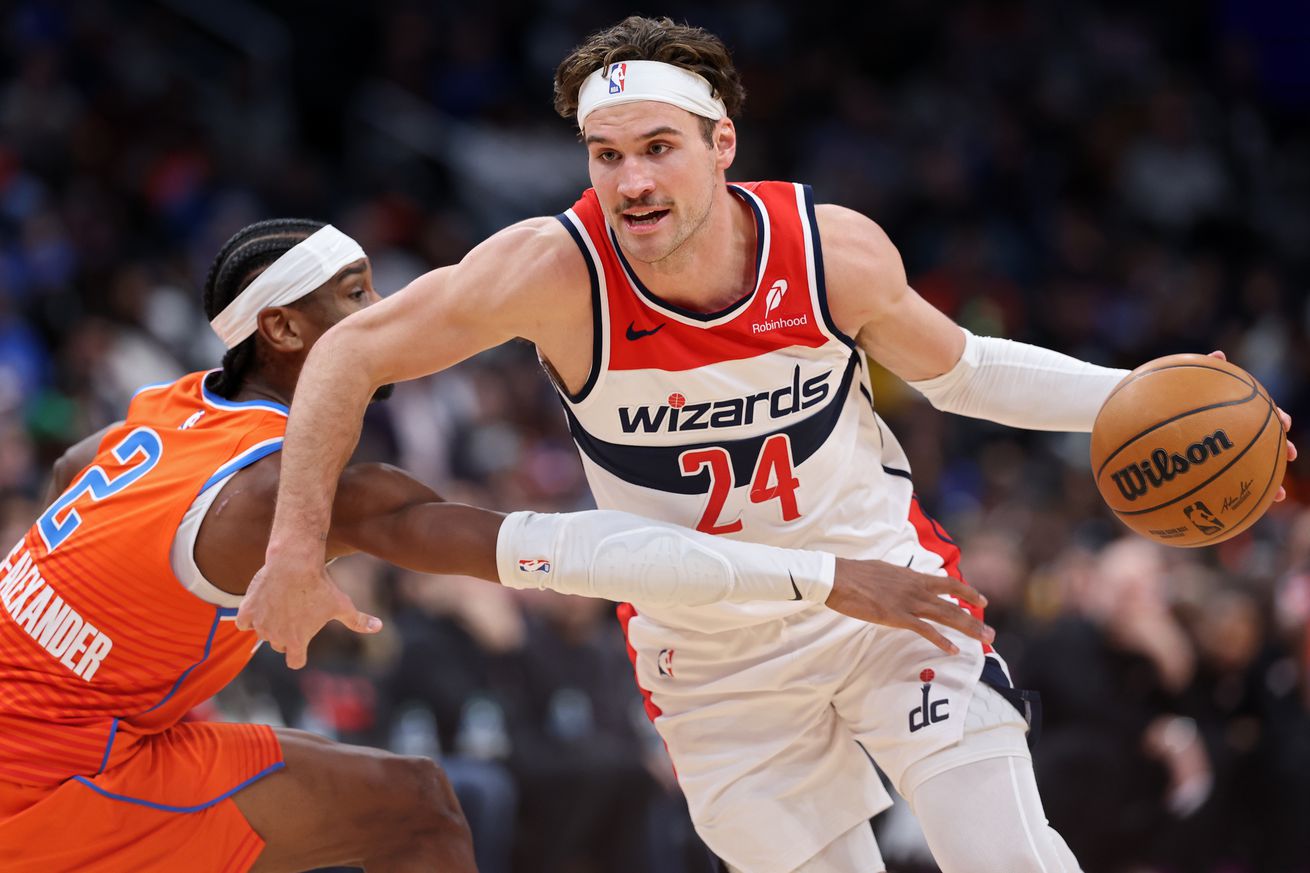
The Washington Wizards are back to chasing history. They lost by 33 points Friday night to the Chicago Bulls, and then topped themselves, losing by 41 to the Oklahoma City Thunder. The game itself probably wasn’t as close as the final margin.
The Wizards did briefly take a one-point lead about nine minutes into the first quarter. From there, they were vanquished by one of the strongest teams in NBA history. At +12.3, Oklahoma City entered last night’s game with the largest strength of schedule adjusted scoring margin ever. They increased that number significantly in their stomping of the Wizards.
For Washington, the defeat ties for the 15th largest in franchise history. They now have 17 defeats all-time by 40 points or more. Weirdly, the Wizards now have consecutive 41-point losses to the Thunder. OKC beat them 147-106 the last time they met, which was Feb. 23, 2024 in Oklahoma City.
It’s the team’s second worst home loss in history. The biggest home blowout loss was by 42 to the Brooklyn Nets on Nov. 4, 2022.
Bright spots for the Wizards?
- They made progress towards maintaining the highest possible chance of landing a top draft pick, and Cooper Flagg has been playing great lately. Yes, when the game started on Playback, I promised viewers we’d talk about draft prospects when one of the teams took a 20-point lead. So, we spent a good chunk of the second half with me keeping one eye on the game and the other scanning the numbers and giving my thoughts on the prospects based on that statistical perusal. And yes, Flagg’s numbers look impressive.
- Corey Kispert made shots — 6-9 from the floor, 3-5 from three.
- Alex Sarr made shots (4-7 from the floor, 2-4 from deep) and had 6 rebounds and 2 blocks in 25 minutes.
- Bilal Coulibaly had a 22.0% usage rate.
- Bub Carrington shot poorly (2-10 from the floor and 1-6 from three-point range), but he contributed 7 rebounds and 7 assists in 34 minutes.
One inexplicable thing: Jared Butler not entering the game until late in the second half. He’d been on a binge of high-quality games, and he was once again productive in his eight minutes of playing time.
Not so bright spots?
- Jordan Poole shot 3-10 from the floor, 0-6 from three, and committed 6 turnovers to just 4 assists. Poole’s offensive rating (points produced per possession x 100) was 75 on a usage rate of 36.4%. Average this season is 113.3.
- Kyle Kuzma was worse — 2-12 from the floor, 0-6 from deept, and just 2 rebounds, 3 assists, a steal and 3 turnovers in 30 minutes of action. Kuzma’s ortg was 47 with a usage rate of 23.8%.
- With a 90 ortg, this was Washington’s second worst offensive performance of the season. The worst was an 86 ortg against the Cleveland Cavaliers.
- Washington’s effective field goal percentage was 39.2% — their worst mark of the season. They connected on just 9-46 from three-point range (19.6%), which is their fourth worst three-point percentage of 2024-25. So far.
- This was Washington’s 8th worst defensive rating of the season.
- The Wizards were -41 when Carrington was on the floor and -40 when Kuzma was in the game.
The Wizards are back in action tonight against the Minnesota Timberwolves.
Four Factors
Below are the four factors that decide wins and losses in basketball — shooting (efg), rebounding (offensive rebounds), ball handling (turnovers), fouling (free throws made).
Stats & Metrics
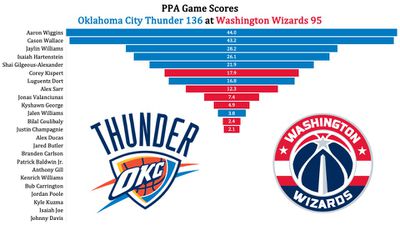
Below are a few performance metrics, including the Player Production Average (PPA) Game Score. PPA is my overall production metric, which credits players for things they do that help a team win (scoring, rebounding, playmaking, defending) and dings them for things that hurt (missed shots, turnovers, bad defense, fouls).
Game Score (GmSC) converts individual production into points on the scoreboard. The scale is the same as points and reflects each player’s total contributions for the game. The lowest possible GmSC is zero.
PPA is a per possession metric designed for larger data sets. In small sample sizes, the numbers can get weird. In PPA, 100 is average, higher is better and replacement level is 45. For a single game, replacement level isn’t much use, and I reiterate the caution about small samples sometimes producing weird results.
POSS is the number of possessions each player was on the floor in this game.
ORTG = offensive rating, which is points produced per individual possessions x 100. League average last season was 114.8. Points produced is not the same as points scored. It includes the value of assists and offensive rebounds, as well as sharing credit when receiving an assist.
USG = offensive usage rate. Average is 20%.
ORTG and USG are versions of stats created by former Wizards assistant coach Dean Oliver and modified by me. ORTG is an efficiency measure that accounts for the value of shooting, offensive rebounds, assists and turnovers. USG includes shooting from the floor and free throw line, offensive rebounds, assists and turnovers.
+PTS = “Plus Points” is a measure of the points gained or lost by each player based on their efficiency in this game compared to league average efficiency on the same number of possessions. A player with an offensive rating (points produced per possession x 100) of 100 who uses 20 possessions would produce 20 points. If the league average efficiency is 114, the league — on average — would produced 22.8 points in the same 20 possessions. So, the player in this hypothetical would have a +PTS score of -2.8.
Note: Aaron Wiggins and Cason Wallace had nearly identical PPA scores (306 for Wiggins to 307 for Wallace). In the table above, they’re both shown playing 30 minutes due to rounding. Wiggins played 30 minutes, 28 seconds; Wallace 29:47. That gave Wiggins two extra possessions, which pushed his PPA Game Score very slightly ahead of Wiggins’ for the game.

by Kevin Broom
