Stats, analysis, commentary. Plus: Should Jordan Poole take more extreme range shots?
Missing Bilal Coulibaly, Alex Sarr, and Kyle Kuzma due to injury, the Washington Wizards hung tough against the vastly superior Oklahoma City Thunder before succumbing to a fourth quarter onslaught and losing, 123-105.
The Wizards were +18 at the three-point line but lost all of the four factors. Despite the deficit at the three-point line, OKC shot slightly better, gathered a season-high 19 offensive rebounds to Washington’s 13, committed just 12 turnovers to the Wizards’ 19, and won at the free throw line, 19-17. That was enough for the Thunder to overcome an array of missed layups and a subpar shooting night from three (10-38, 26.3%) and coast into the holidays with a comfortable 18-point victory.
Washington kept the margin close for three quarters because they shot well from three-point range — 16-35 (45.7%) — during the first 36 minutes. They lost because that hot shooting stopped (0-8 from deep in the fourth quarter), and they kept on committing turnovers and giving up offensive rebounds.
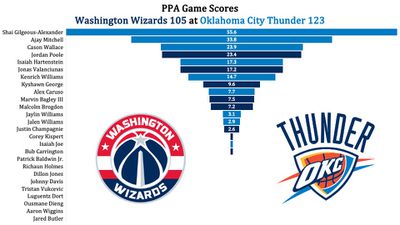
They also lost for the same reason so many other teams have fallen to OKC this season — they had no answers for Shai Gilgeous-Alexander, who scored 41 points on 25 shots and finished with an offensive rating (points produced per possession x 100) of 141. The Thunder also got outstanding performances from rookie Ajay Mitchell, as well as Cason Wallace, Isaiah Hartenstein, and Kenrich Williams.
Bright spots?
- Jordan Poole juked and jitterbugged his way to 31 points and 7 assists. I didn’t love his ball security (4 turnovers) or his shot selection, but the results were good, especially when he attacked with decisiveness and quickness. The effectiveness of his “bag” of dribble-dance moves leaves a bit to be desired.
- Jonas Valanciunas battled inside to finish with 12 points, 15 rebounds (4 offensive), 2 steals and 2 blocks.
- Kyshawn George hit 3-6 from deep and had a couple steals.
- Bub Carrington shot 4-8 from three.
One not to bright spot: Marvin Bagley III was playing reasonably well until Corey Kispert pushed Hartenstein, who fell into Bagley’s leg, buckling his knee in a way knees are not supposed to bend. Bagley’s screams were audible over arena floor microphone.
Learning moment: During the Playback call, I got annoyed at one of Poole’s extreme range shot attempts. I decided to look up his shooting percentage on those types of shots expecting to see a terrible percentage. What I found surprised me. Here’s Poole’s eFG% from extreme ranges (not including last night’s game):
- 28+ feet — 23-51, 67.6% eFG% (7th best among all players with at least 15 attempts from this range)
- 30+ feet — 8-21, 57.1% eFG% (4th best among players with at least 10 attempts)
- 32+ feet — 5-14, 53.6% eFG% (1st among the five players with at least 10 attempts)
Keep in mind that the league average eFG% this season 54.0%.
The other four with at least 10 attempts from 32+ feet — Luka Doncic, Fred VanVleet, Payton Pritchard, and Trae Young. Doncic, VanVleet, and Pritchard are all 3-10. Young is 6-22.
Now, I’d still like Poole to rein in those long shots, especially early in the shot clock, because I think it’s better basketball to run some offense before firing up an extreme range shot. That said, his shooting from 28+ feet has almost the same eFG% as an average at-rim attempt (67.6% for Poole shooting from 28+ feet vs. 68.8% at-rim shooting from the full league).
This season’s extreme range shooting is an outlier for Poole, as was last season. Here’s his eFG% by season:
- 2024-25 — 67.6% on 51 attempts so far
- 2023-24 — 44.8% on 154 attempts
- 2022-23 — 51.6% on 154 attempts
- 2021-22 — 52.7% on 111 attempts
- 2020-21 — 50.0% on 63 attempts
- 2019-20 — 36.9% on 61 attempts
For his full career, he’s at 49.7% eFG% on 594 attempts from 28+ feet, per Stathead Basketball.
What’s kinda interesting is that on shots from 28+ feet, he’s knocking down 33.2%. His career three-point percentage is 34.2%. Back out the extreme range shots, and his average is just 34.5%. In other words, the extreme range attempts aren’t dragging down his percentage much and may have some value in attracting enhanced defensive attention.
I still don’t love those shots, but there may be some value in launching them now and then, and there’s definitely value if he can hit them at a rate anything close to what he’s shooting on those attempts this season.
Four Factors
Below are the four factors that decide wins and losses in basketball — shooting (efg), rebounding (offensive rebounds), ball handling (turnovers), fouling (free throws made).
Stats & Metrics
Below are a few performance metrics, including the Player Production Average (PPA) Game Score. PPA is my overall production metric, which credits players for things they do that help a team win (scoring, rebounding, playmaking, defending) and dings them for things that hurt (missed shots, turnovers, bad defense, fouls).
Game Score (GmSC) converts individual production into points on the scoreboard. The scale is the same as points and reflects each player’s total contributions for the game. The lowest possible GmSC is zero.
PPA is a per possession metric designed for larger data sets. In small sample sizes, the numbers can get weird. In PPA, 100 is average, higher is better and replacement level is 45. For a single game, replacement level isn’t much use, and I reiterate the caution about small samples sometimes producing weird results.
POSS is the number of possessions each player was on the floor in this game.
ORTG = offensive rating, which is points produced per individual possessions x 100. League average last season was 114.8. Points produced is not the same as points scored. It includes the value of assists and offensive rebounds, as well as sharing credit when receiving an assist.
USG = offensive usage rate. Average is 20%.
ORTG and USG are versions of stats created by former Wizards assistant coach Dean Oliver and modified by me. ORTG is an efficiency measure that accounts for the value of shooting, offensive rebounds, assists and turnovers. USG includes shooting from the floor and free throw line, offensive rebounds, assists and turnovers.
+PTS = “Plus Points” is a measure of the points gained or lost by each player based on their efficiency in this game compared to league average efficiency on the same number of possessions. A player with an offensive rating (points produced per possession x 100) of 100 who uses 20 possessions would produce 20 points. If the league average efficiency is 114, the league — on average — would produced 22.8 points in the same 20 possessions. So, the player in this hypothetical would have a +PTS score of -2.8.

