Stats, analysis, commentary
The 2024-25 Washington Wizards are at a level where they’re no longer playing the team in different colored uniforms. They’re playing history.
Their latest debacle was a 137-101 drubbing by the Dallas Mavericks. It was Washington’s 16th consecutive defeat — the third time in franchise history they’ve lost that many in a row. The last time was last season.
The other time was the 2009-10 squad that featured Gilbert Arenas and Javaris Crittenton bringing guns into the locker room, followed by team president Ernie Grunfeld blowing up the team by trading off all the salable veterans.
What’s ahead for this year’s team seems likely to extend the losing streak for awhile. Here’s the schedule:
- Dec. 7 vs. Denver Nuggets — that’s 17
- Dec. 8 vs. Memphis Grizzlies — 18
- Dec. 13 at Cleveland Cavaliers — 19
- Dec. 15 vs. Boston Celtics — 20
- Dec. 19 vs. Charlotte Hornets — maybe the streak ends there?
If they lose that one, they’ll have another shot Dec. 26 at Charlotte, and then a Jan. 1 matchup against the Chicago Bulls. If they somehow lose all of those, they’ll face the sad-sack New Orleans Pelicans in a home-and-home series for a potentially recording-tying 28th loss in a row, and a record-breaking 29th.
I think the Wizards are more likely than not to get a win somewhere in that range, but they’ll be underdogs in every one of those contests. This could get epic — especially if general manager Will Dawkins can find trade partners for some of the semi-productive veterans.
Last night against the Mavericks, the Wizards were inept at both ends of the floor. Their offensive rating was 98 — the ninth time this season they’ve failed to produce an ortg of 100 or higher. League average: 113.2. Their 134 defensive rating was their second worst of the season.
Bright spots? There were some if you squint hard enough.
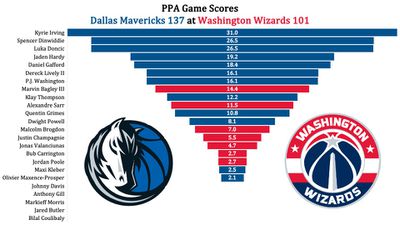
- In his first start of the season, Marvin Bagley III was productive — 16 points and 8 rebounds in 24 minutes. He was 7-11 from the floor and grabbed three offensive boards.
- Alex Sarr was okay — 11 points, 8 rebounds, a steal and two blocks in 27 minutes. Four of his rebounds were on the offensive end.
- Bub Carrington competed hard to the end. His overall production wasn’t good, but he competed.
- Bilal Coulibaly shot 0-10 and committed four turnovers. I know, that’s abysmal and yet…I said at the start of the Playback last night that I’d love to see Coulibaly shoot 2-18 and have 8 turnovers because it would mean he didn’t stop trying to make plays because of misses and mistakes. Don’t get me wrong, he played a terrible game. I’d rather he be aggressive and terrible at this stage than passive and terrible. I mean, he tried to dunk in traffic in the second half and came back a few minutes later to attempt a dunk on Dereck Lively. I’ll take the try.
- The alternate uniforms and court looked nice. The uniforms should be the basis for their everyday look.
Four Factors
Below are the four factors that decide wins and losses in basketball — shooting (efg), rebounding (offensive rebounds), ball handling (turnovers), fouling (free throws made).
Stats & Metrics
Below are a few performance metrics, including the Player Production Average (PPA) Game Score. PPA is my overall production metric, which credits players for things they do that help a team win (scoring, rebounding, playmaking, defending) and dings them for things that hurt (missed shots, turnovers, bad defense, fouls).
Game Score (GmSC) converts individual production into points on the scoreboard. The scale is the same as points and reflects each player’s total contributions for the game. The lowest possible GmSC is zero.
PPA is a per possession metric designed for larger data sets. In small sample sizes, the numbers can get weird. In PPA, 100 is average, higher is better and replacement level is 45. For a single game, replacement level isn’t much use, and I reiterate the caution about small samples sometimes producing weird results.
POSS is the number of possessions each player was on the floor in this game.
ORTG = offensive rating, which is points produced per individual possessions x 100. League average last season was 114.8. Points produced is not the same as points scored. It includes the value of assists and offensive rebounds, as well as sharing credit when receiving an assist.
USG = offensive usage rate. Average is 20%.
ORTG and USG are versions of stats created by former Wizards assistant coach Dean Oliver and modified by me. ORTG is an efficiency measure that accounts for the value of shooting, offensive rebounds, assists and turnovers. USG includes shooting from the floor and free throw line, offensive rebounds, assists and turnovers.
+PTS = “Plus Points” is a measure of the points gained or lost by each player based on their efficiency in this game compared to league average efficiency on the same number of possessions. A player with an offensive rating (points produced per possession x 100) of 100 who uses 20 possessions would produce 20 points. If the league average efficiency is 114, the league — on average — would produced 22.8 points in the same 20 possessions. So, the player in this hypothetical would have a +PTS score of -2.8.
