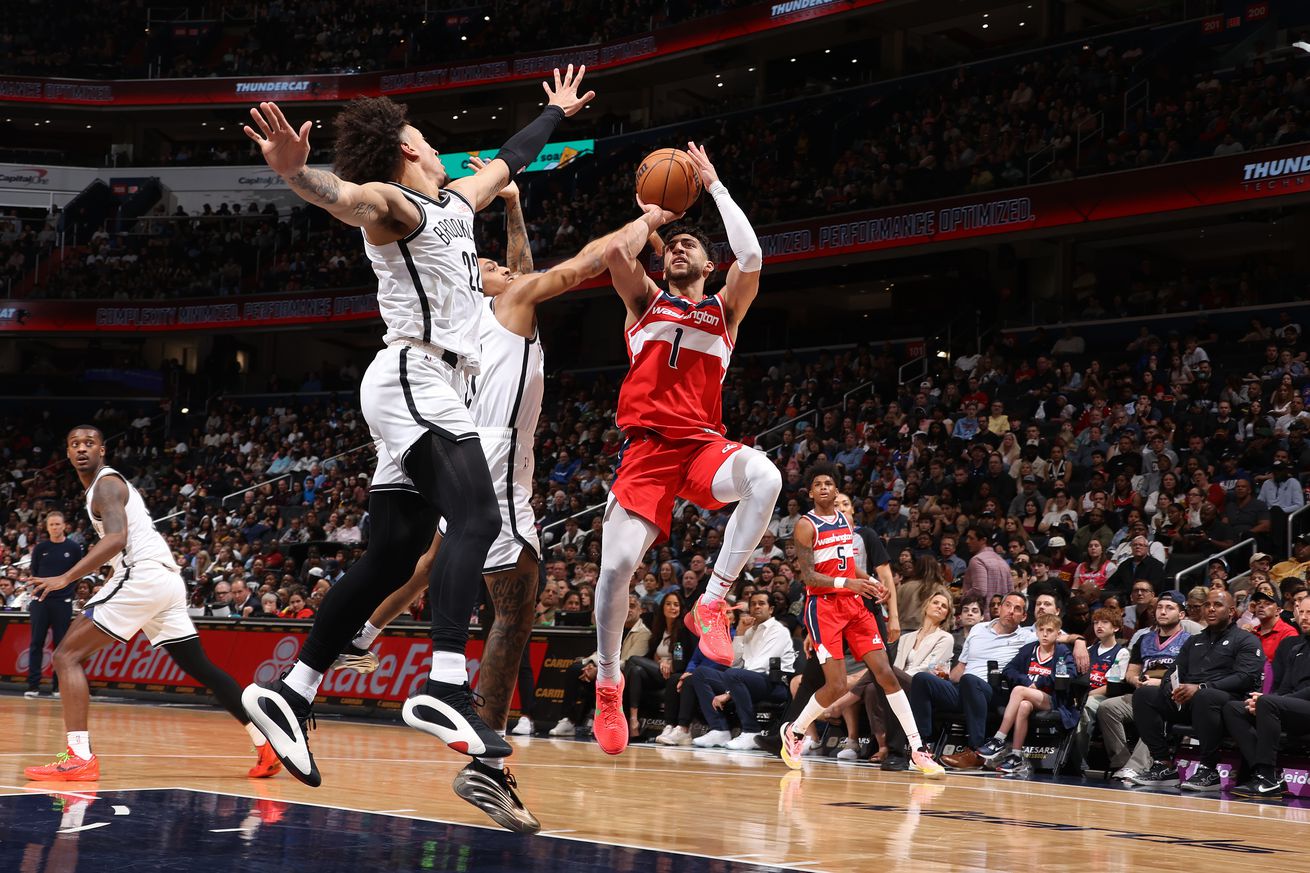
Stats, analysis, commentary
For a game between two of the NBA’s worst teams, this matchup between the Washington Wizards and Brooklyn Nets was pleasantly competitive and entertaining. The Wizards seemed in control during the first half, cruising to a 17-point lead before letting the Nets close the margin to eight at the halfway point.
In the second half, Brooklyn came back, and the teams settled into a contest that remained within a five-point margin until midway through the fourth quarter. Then the Nets went on a run, went up by nine, and seemed to have the game secured…only to see Washington’s “hey, we’re learning on the job” crew come storming back and take a one-point lead on an AJ Johnson three with 23 seconds left to play.
The Nets got the go-ahead bucket on a Drew Timme roll to the rim and a goaltend (correctly called) on JT Thor. The Wizards couldn’t score again and ended up losing by three.
Bright Spots for the Wizards
- They didn’t lose by 53 this time out.
- Colby Jones scored 20 points on 11 shots with just one made three. He added 4 assists and 3 steals. With some work on his body and more experience, he looks like he could be a future contributor.
- Jaylen Martin, one of three Wizards players on two-way contracts (all of whom played at least 23 minutes) had 13 points, 6 rebounds, 3 assists and zero turnovers.
- Bub Carrington was very good in his 22 minutes of action — 10 points on 4 shots, 3 rebounds, 2 assists.
- Justin Champagnie started and made the most of his 17 minutes with 9 points and 9 rebounds.
- AJ Johnson had a subpar game overall but erupted for 14 fourth quarter points with 5-7 shooting, a spectacular reverse dunk and a pair of threes in the final 1:27 to give the Wizards a chance to win.
- Jordan Poole made two more threes, which brings his season total to 221. That’s just two behind the franchise record of 223 by Bradley Beal in 2016-17.
- Head coach Brian Keefe used a lineup of AJ Johnson, Colby Jones, Jalen Martin, Tristan Vukcevic, and JT Thor for the entire fourth quarter. For the game, 212 of the team’s 240 minutes went to players age 23 or younger. The only players older who got minutes were Jordan Poole and Marcus Smart.
Four Factors
Below are the four factors that decide wins and losses in basketball — shooting (efg), rebounding (offensive rebounds), ball handling (turnovers), fouling (free throws made).
The four factors are measured by:
- eFG% (effective field goal percentage, which accounts for the three-point shot)
- OREB% (offensive rebound percentage)
- TOV% (turnover percentage — turnovers divided by possessions)
- FTM/FGA (free throws made divided by field goal attempts)
In the table below are the four factors using the percentages and rates traditionally presented. There’s also a column showing league average in each of the categories to give a sense of each team’s performance relative to the rest of the league this season.
Stats & Metrics
Below are a few performance metrics. PPA is my overall production metric, which credits players for things they do that help a team win (scoring, rebounding, playmaking, defending) and dings them for things that hurt (missed shots, turnovers, bad defense, fouls).
PPA is a per possession metric designed for larger data sets. In small sample sizes, the numbers can get weird. In PPA, 100 is average, higher is better and replacement level is 45. For a single game, replacement level isn’t much use, and I reiterate the caution about small samples sometimes producing weird results.
POSS is the number of possessions each player was on the floor in this game.
ORTG = offensive rating, which is points produced per individual possessions x 100. League average last season was 114.8. Points produced is not the same as points scored. It includes the value of assists and offensive rebounds, as well as sharing credit when receiving an assist.
USG = offensive usage rate. Average is 20%.
ORTG and USG are versions of stats created by former Wizards assistant coach Dean Oliver and modified by me. ORTG is an efficiency measure that accounts for the value of shooting, offensive rebounds, assists and turnovers. USG includes shooting from the floor and free throw line, offensive rebounds, assists and turnovers.
+PTS = “Plus Points” is a measure of the points gained or lost by each player based on their efficiency in this game compared to league average efficiency on the same number of possessions. A player with an offensive rating (points produced per possession x 100) of 100 who uses 20 possessions would produce 20 points. If the league average efficiency is 114, the league — on average — would produced 22.8 points in the same 20 possessions. So, the player in this hypothetical would have a +PTS score of -2.8.
Players are sorted by total production in the game.