Recap plus stats, analysis, commentary
The Washington Wizards played reasonably well, and the Cleveland Cavaliers had an off shooting night, which was enough for the Wizards to keep the score close enough for the game to provide meaningful minutes to the team’s youngsters and entertainment for fans. The Wizards lost in the end, 115-105 — a respectable 10-point deficit to one of the best teams in the NBA this season.
Don’t over-credit the Wizards, though. Cleveland entered the game shooting 40.4% on threes — the best mark in the NBA this season. Against Washington, they bricked wide open looks they usually knock down en route to a 15-50, 30.0% night from the three-point line. If they shot their average against the Wizards, that’d be another five threes, and 15 more points.
The Wizards outshot the Cavs — 55.8% eFG% to 47.8% — which is usually the single best indicator of who wins in the NBA. Unfortunately, Cleveland dominated each of the other key indicators, winning on the offensive glass 16-6, in turnovers 17-11, and from the free throw line 28-9.
It might be tempting to look at the free throw disparity or the fouls called differential (the Wizards were whistled for 28 to Cleveland’s 14) and think the refs were up to some shenanigans. This was not the case. The Wizards were doing a lot of hacking and reaching and flinging about of their bodies, and they earned the fouls called on them.
Credit the Wizards with staying competitive throughout the game. The score was knotted after the first quarter, and they “lost” the other three by three, four, and three points respectively. Their biggest deficit was 12 points, and they were hustling and knocking down threes to slice the lead to just five points with three minutes to play.
Bright spots?
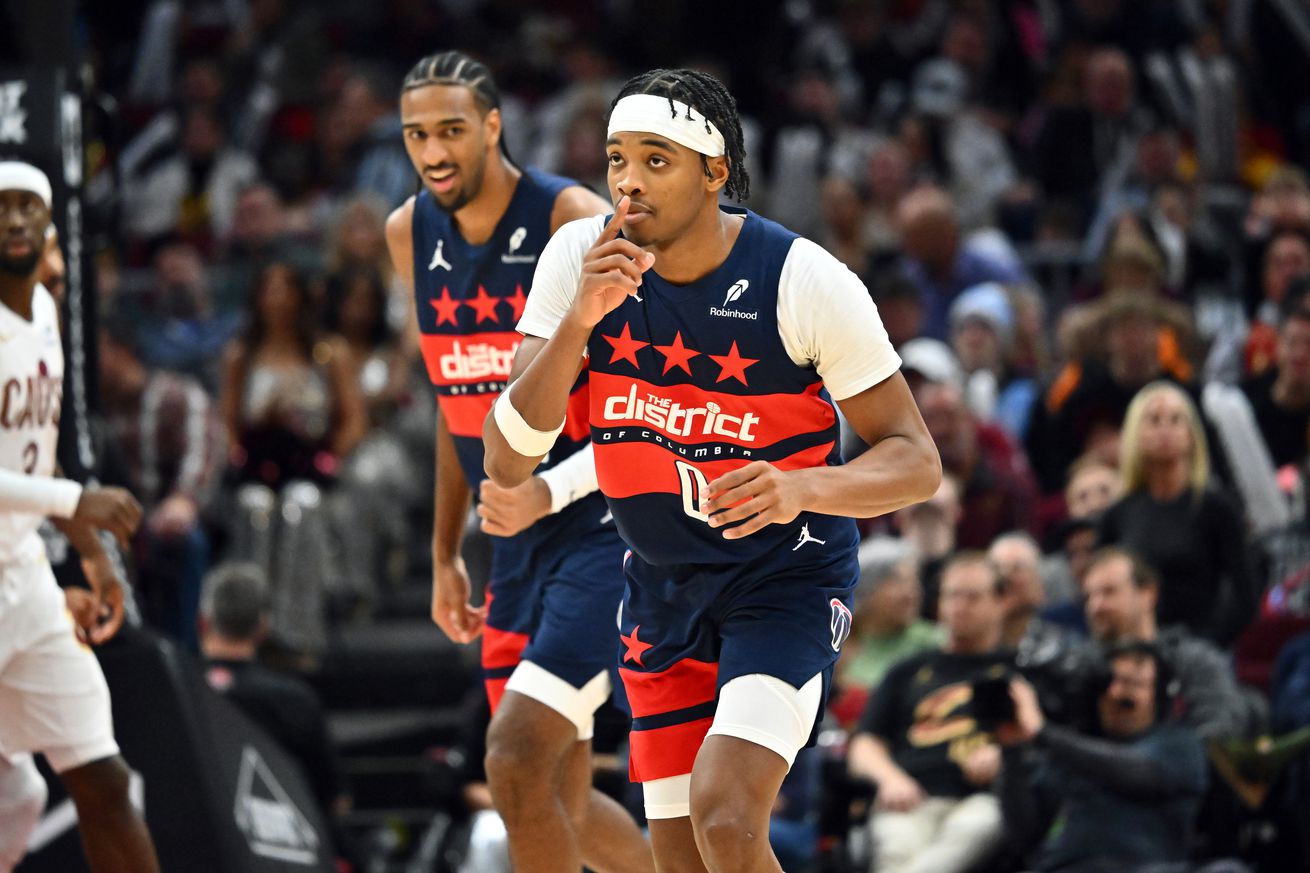
- Bilal Coulibaly played a terrific all-around game — 27 points, 6 rebounds, 5 assists, 2 blocks. He shot 10-18 from the field, 5-8 from three, and even better: kept on firing even after some fugly misses in the first half. He committed a couple turnovers he’d like to have back, but he posted a 126 offensive rating (average is 113.3) on 23.9% usage. This is the way.
- Alex Sarr got overwhelmed at times by Jarrett Allen and committed four fouls. He also fought back, hit some tough hooks in the lane and knocked down a pair of threes. His line: 14 points on 10 shots, 2-4 from three, 7 rebounds, 2 assists, a block and a steal.
- With Malcolm Brogdon out with an injury and Bub Carrington sitting with foul trouble, Johnny Davis played 27 good minutes. He finished with 8 points, 5 rebounds, 2 assists, 2 steals and a block. He hit 2-5 from three-point range. At minimum, he put some good things on video for his next team.
- Justin Champagnie continued to make the most of his opportunity to start with a solid 16 points, 8 rebounds against Cleveland.
The loss drops Washington’s record to 3-20. They’re in action again Sunday night in Washington against the Boston Celtics.
Four Factors
Below are the four factors that decide wins and losses in basketball — shooting (efg), rebounding (offensive rebounds), ball handling (turnovers), fouling (free throws made).
Stats & Metrics
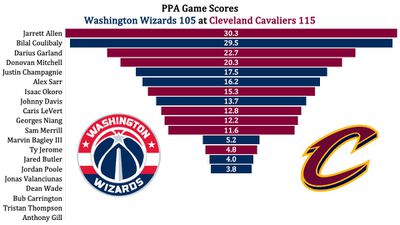
Below are a few performance metrics, including the Player Production Average (PPA) Game Score. PPA is my overall production metric, which credits players for things they do that help a team win (scoring, rebounding, playmaking, defending) and dings them for things that hurt (missed shots, turnovers, bad defense, fouls).
Game Score (GmSC) converts individual production into points on the scoreboard. The scale is the same as points and reflects each player’s total contributions for the game. The lowest possible GmSC is zero.
PPA is a per possession metric designed for larger data sets. In small sample sizes, the numbers can get weird. In PPA, 100 is average, higher is better and replacement level is 45. For a single game, replacement level isn’t much use, and I reiterate the caution about small samples sometimes producing weird results.
POSS is the number of possessions each player was on the floor in this game.
ORTG = offensive rating, which is points produced per individual possessions x 100. League average last season was 114.8. Points produced is not the same as points scored. It includes the value of assists and offensive rebounds, as well as sharing credit when receiving an assist.
USG = offensive usage rate. Average is 20%.
ORTG and USG are versions of stats created by former Wizards assistant coach Dean Oliver and modified by me. ORTG is an efficiency measure that accounts for the value of shooting, offensive rebounds, assists and turnovers. USG includes shooting from the floor and free throw line, offensive rebounds, assists and turnovers.
+PTS = “Plus Points” is a measure of the points gained or lost by each player based on their efficiency in this game compared to league average efficiency on the same number of possessions. A player with an offensive rating (points produced per possession x 100) of 100 who uses 20 possessions would produce 20 points. If the league average efficiency is 114, the league — on average — would produced 22.8 points in the same 20 possessions. So, the player in this hypothetical would have a +PTS score of -2.8.

